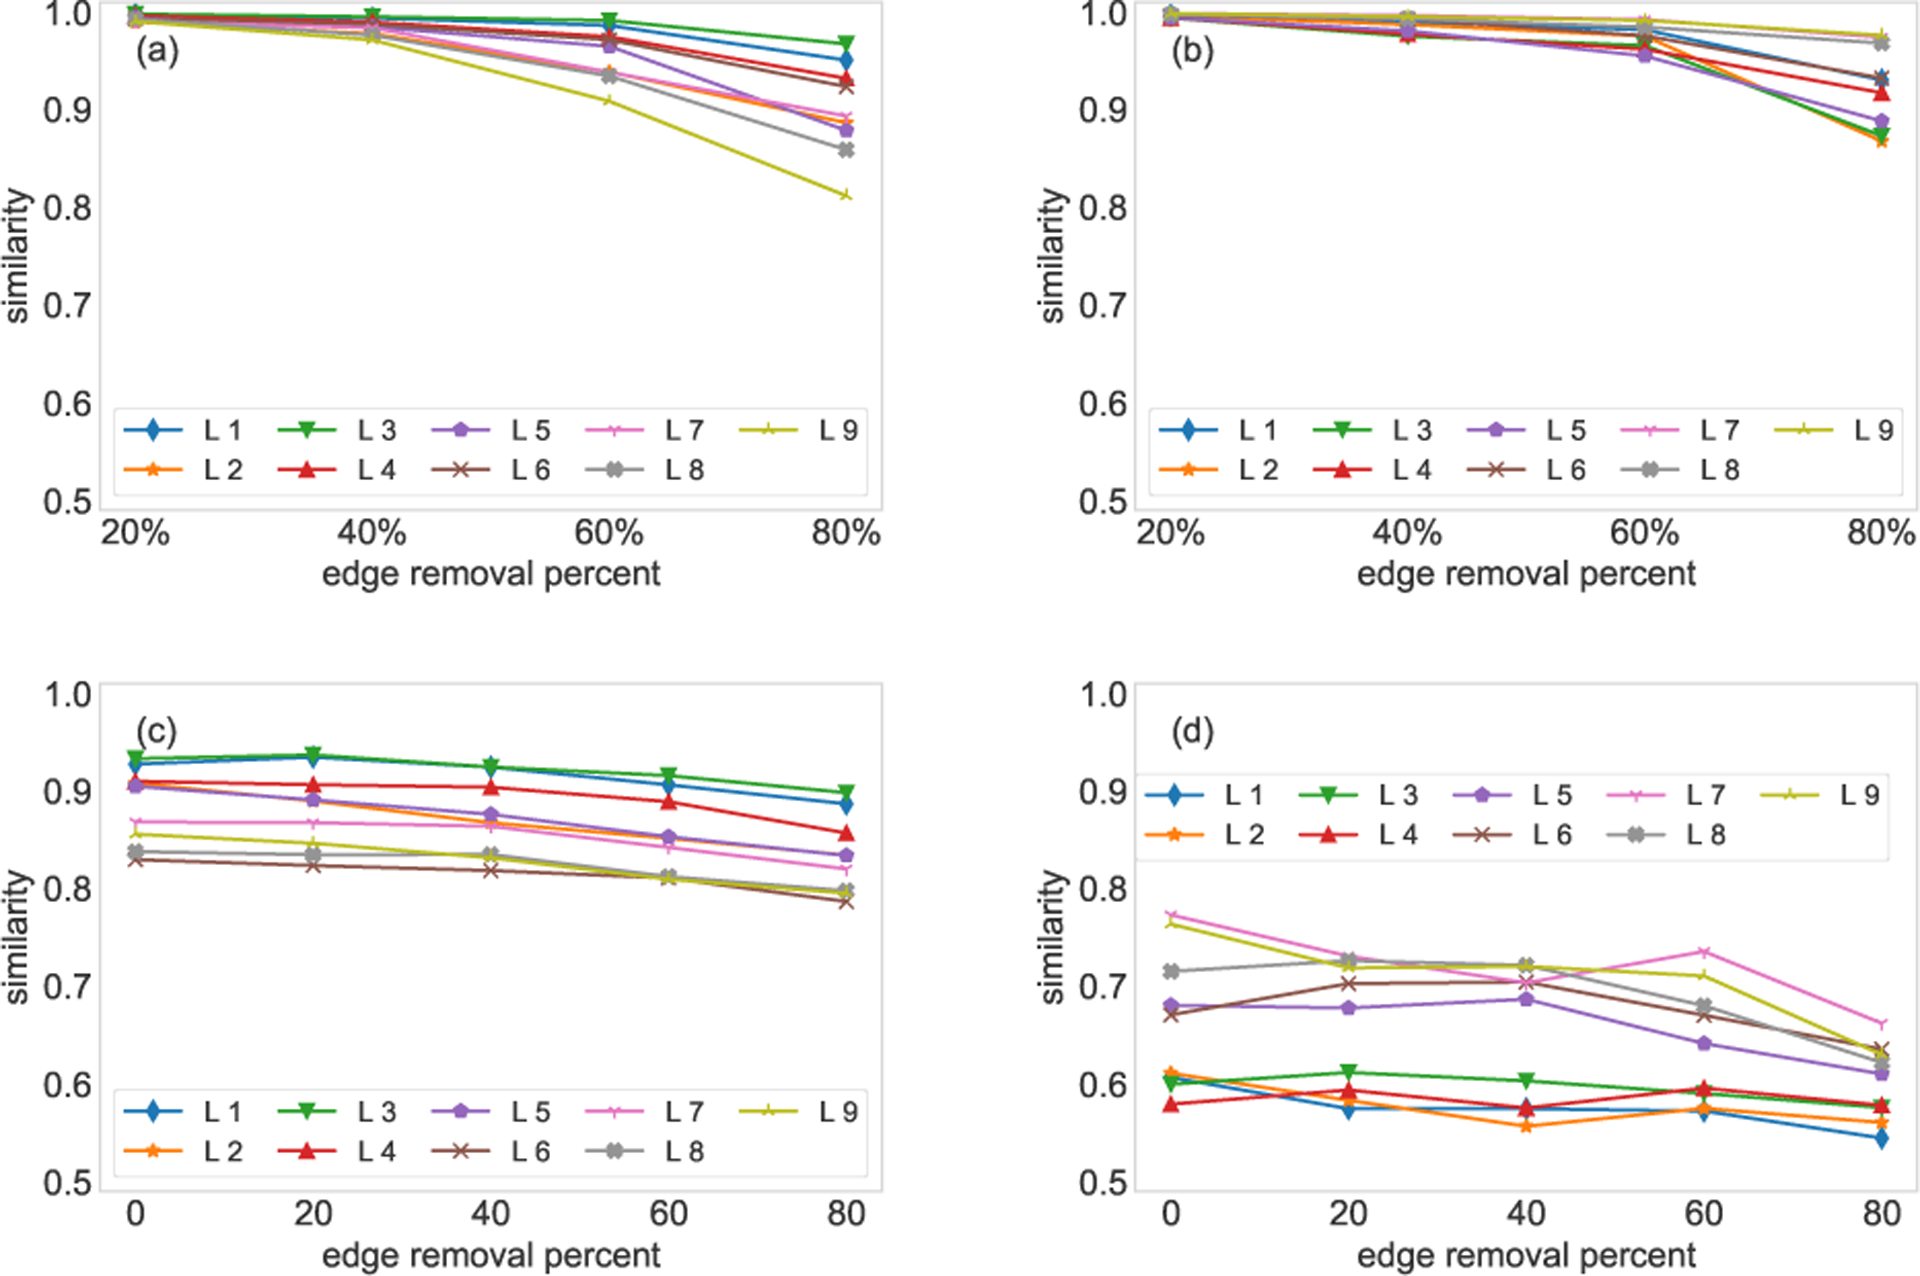
FIG. 3.

Eigenvector centrality-based SimHash algorithm. Panel (a) shows the comparison between the first nine layers of the FAO network and their incomplete counterparts, where 20%, 40%, 60% and 80% edges are removed uniformly at random from the target layer. Panel (b) shows the same experiment on the HVR network. Panel (c) compares the reduced networks (the first nine layers of the FAO network) with the five most similar layers. The mean of the similarities is shown in the panel. Similarly, 20%, 40%, 60% and 80% edges are removed uniformly at random from the target layer. Panel (d) shows the same experiment on the HVR network. Note that each similarity value is averaged over 10 runs.
