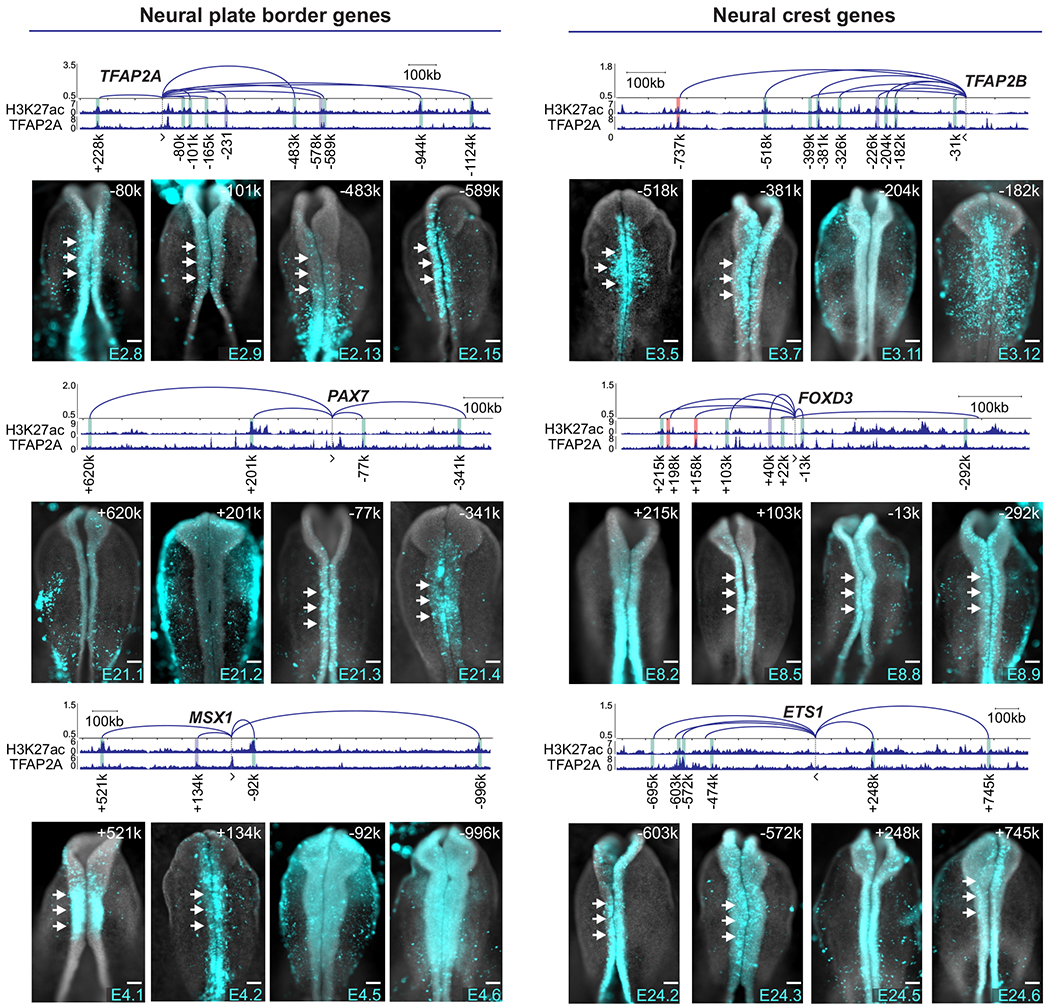
Figure 2. Enrichment and frequency of interaction with promoters are strong predictors of enhancer activity.

Reporter assays in transgenic embryos show domains of activity of enhancers that interact with promoters of NC genes. y-axis in arc plot represents Z-scores calculated from the mean counts of NC HiChIP replicates. All NC-enriched contacts co-occupied by TFAP2A are presented. Enhancer-promoter contacts are identified by its loop width (+, upstream or −, downstream gene’s promoter). Vertical bars indicate regions tested in enhancer-reporter assays. Representative image of enhancer activity is displayed for four elements per gene (See also Figure S2A). Gray bars represent previously published enhancers, green novel distal elements with cranial activity at HH9-10 stages and red bars represent tested regions with no cranial activity at HH9-10 stages. White arrows indicate activity in the NC. Kb, kilobase. Scale bar, 100um.
