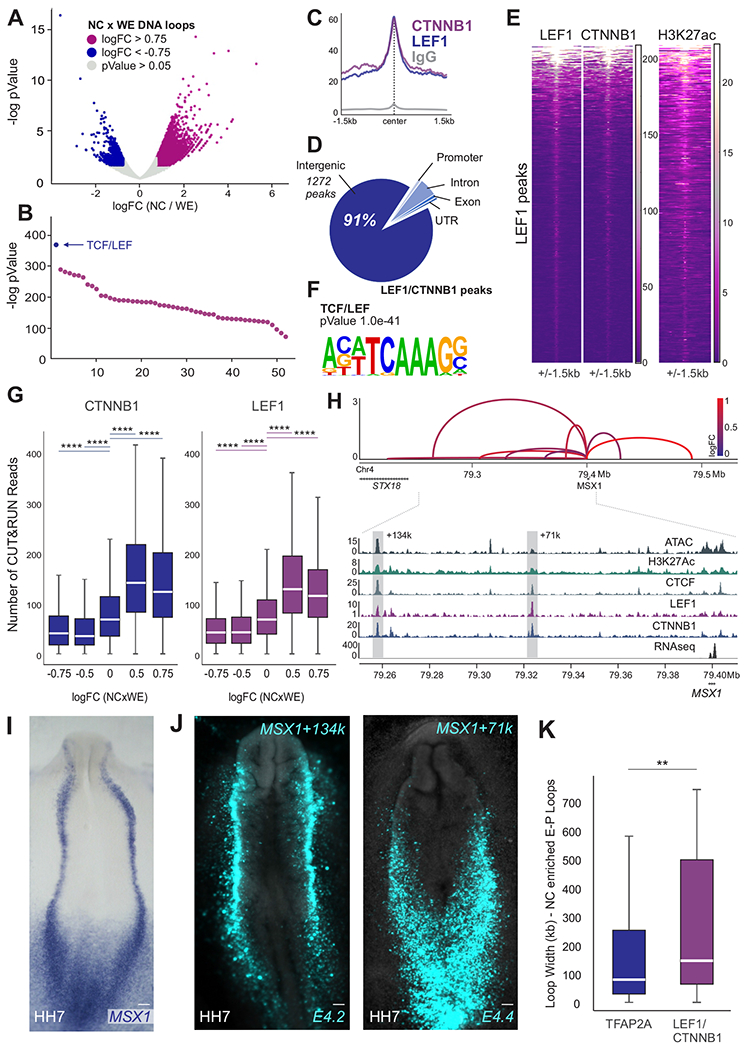
Figure 3. Genome-wide mapping of nuclear effectors identifies direct targets of canonical Wnt signaling.

(A) Volcano plot depicting all enhancer-promoter contacts after quality control. Highlighted dots represent NC-enriched (logFC>0.75, pValue<0.05) and depleted (logFC<−0.75, pValue<0.05) contacts.
(B) Transcription factor binding sites identified in NC-enriched vs. depleted putative enhancer-promoter contacts highlighted in (A).
(C) CUT&RUN profiles showing binding of LEF1, CTNNB1 and normal rabbit IgG at LEF1 bound peaks.
(D) Pie chart depicting genomic location of LEF1/CTNNB1 peaks.
(E) Heatmaps displaying LEF1, CTNNB1 and H3K27ac CUT&RUN signal at LEF1 peaks.
(F) Motif enrichment analysis shows enrichment for the TCF/LEF motif in regions co-occupied by LEF1/CTNNB1.
(G) Boxplots displaying read counts of CTNNB1 and LEF1 CUT&RUN at HiChIP loops.
(H) Arc plot depicting putative enhancer-promoter contacts, ATAC-seq, RNA-seq and CUT&RUN profiles for H3K27ac, CTCF, LEF1 and CTNNB1 at the MSX1 locus. y-axis of arc plot represents Z-scores calculated from the mean counts of NC HiChIP replicates. Arc color represents loop enrichment in NC (logFC NCxWE). Dotted boxes highlight enhancers E4.2 (loop MSX1+134k) and E4.4 (loop MSX1+71k).
(I-J) Whole-mount in situ hybridization for MSX1 (I) and activity of enhancer regions E4.2 and E4.4 (J) shown via transient transgenesis. Enhancers E4.2 and E4.4 are active in the neural plate border.
(K) Size (loop width) of the strongest TFAP2A or LEF1/CTNNB1-bound loop per gene. TFAP2A is a marker of active NC enhancers, and thus represents average NC loop size (Figure S1F) while LEF1/CTNNB1 bound loops display more distal contacts.
Also see Figure S3. LEF1 and CTNNB1 CUT&RUN performed in 2 biological replicates. NC, neural crest; WE, whole embryo; HH, Hamburger and Hamilton; kb; kilobase; Mb, megabase. Scale bar, 100um. **p<0.01, ****p<0.0001.
