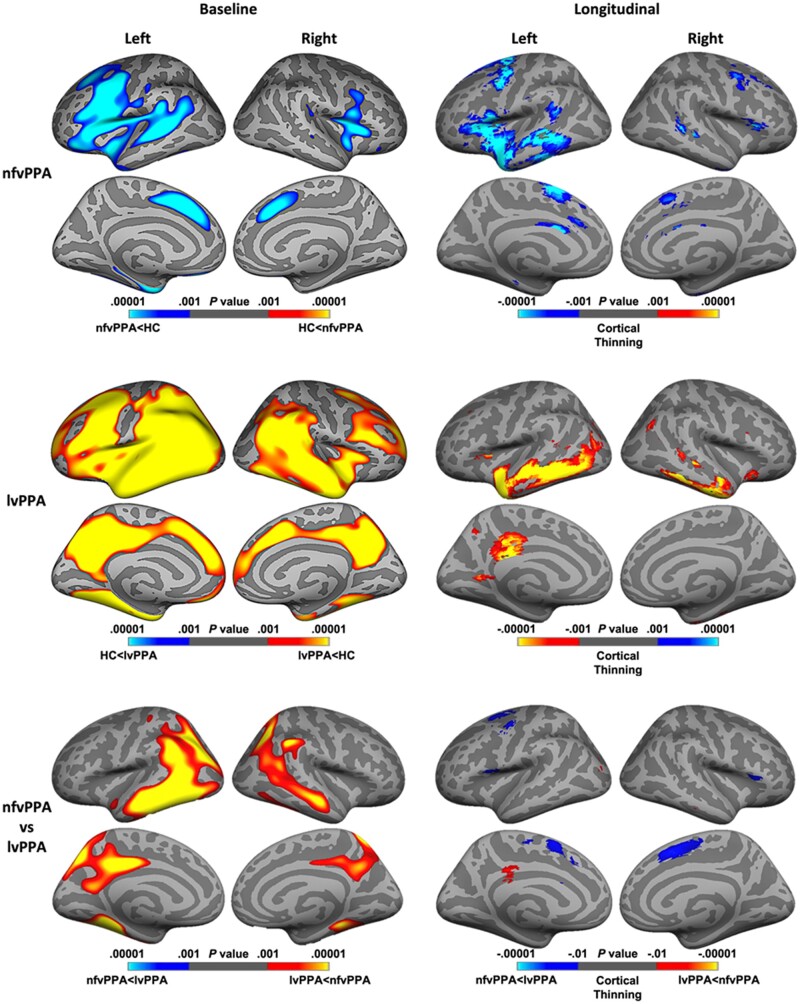
Figure 3.
Baseline and longitudinal patterns of cortical thinning in nfvPPA and lvPPA. Regions of greater cortical atrophy are depicted in blue for nfvPPA and in red-yellow for lvPPA. The left panel shows atrophy findings at baseline in PPA groups compared with controls (top and middle row), and between PPA groups (bottom row). Baseline results are thresholded at P = 0.001, uncorrected for multiple comparisons. The right panel shows regions of cortical thinning over time within (top and middle trow) and between (bottom row) PPA groups. Longitudinal results are thresholded at P = 0.001 for within-group analysis, and at P = 0.01 for between-group analysis, uncorrected for multiple comparisons. lvPPA, logopenic variant primary progressive aphasia; nfvPPA, non-fluent variant primary progressive aphasia.

