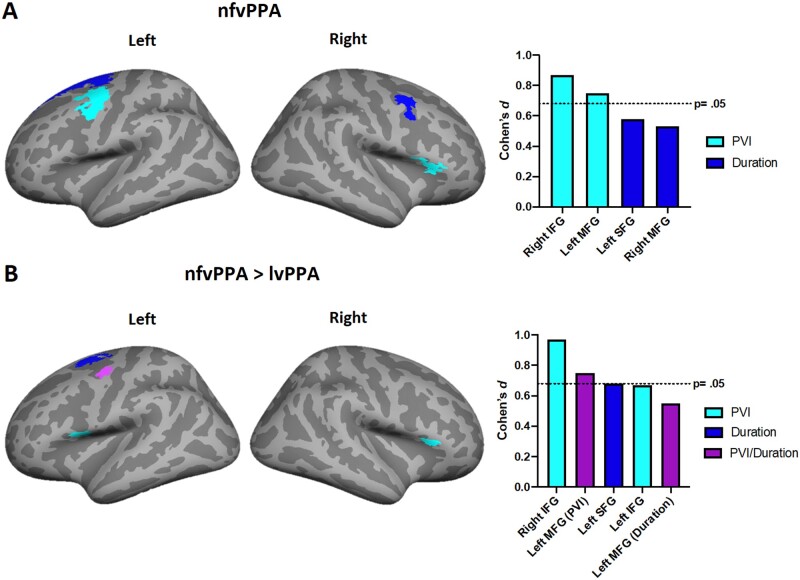
Figure 4.
Brain regions showing associations between temporal speech measures and cortical thinning in nfvPPA and lvPPA. Coloured regions depict associations between cortical atrophy of ROIs and changes in PVI (light blue) or word duration (dark blue). The cortical region represented in purple was independently associated with changes in PVI and duration in nfvPPA compared to lvPPA. Panel A depict changes in nfvPPA over time. Panel B depict greater changes in nfvPPA compared with lvPPA. The Y-axis indicates the effect size (Cohen’s d: small = 0.20; medium = 0.50; large = 0.80). The X-axis indicates the anatomical regions underpinning the effect. Longitudinal results are thresholded at P =0.05 corrected for multiple comparisons. lvPPA, logopenic variant primary progressive aphasia; nfvPPA, non-fluent variant primary progressive aphasia.

