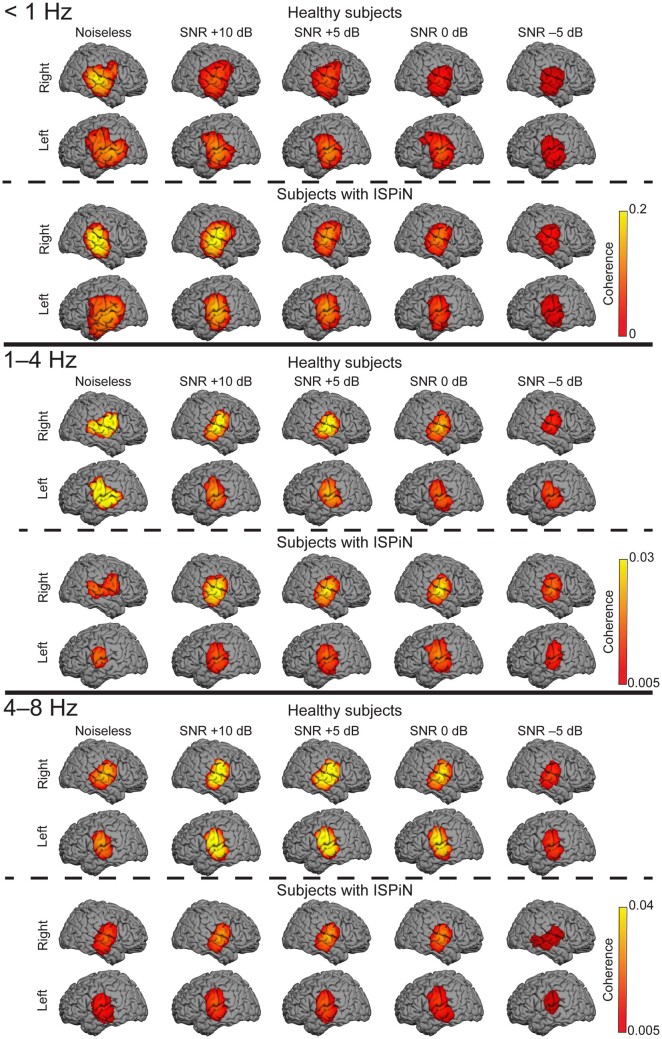
Figure 3.
Cortical tracking of the Attended stream at <1, 1–4 and 4–8 Hz. The group-level coherence maps were masked statistically above the significance level (maximum-based permutation statistics). One source distribution is displayed for each possible combination of the group (healthy subjects, top panel; subjects with ISPiN, bottom panel) and listening condition (from left to right, Noiseless, +10, +5, 0 and −5 dB).

