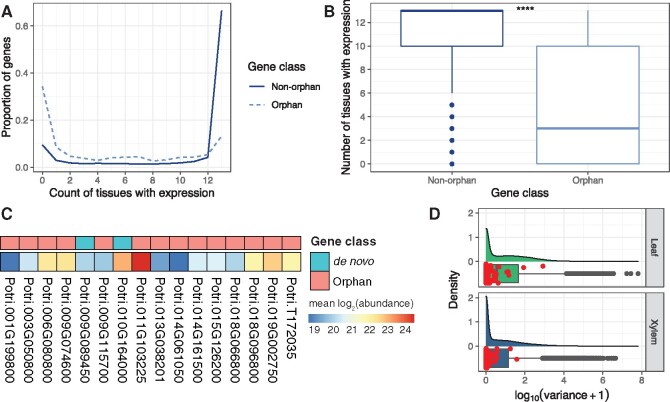
Fig. 3.
Orphan gene expression breadth, translation evidence, and expression variation in the GWAS mapping panel. (A) Expression breadth across 13 Populus trichocarpa tissues. (B) Expression breadth distribution across 13 tissues derived from the JGI Gene Atlas project, which is publicly available RNA-Seq data (supplementary table S11, Supplementary Material online) (**** = P < 1e−4, Wilcoxon signed rank test). (C) A total of 16 orphan and de novo genes with proteomic data (MS/MS), shown is the mean of the log2 transformed abundance values across six P. trichocarpa genotypes. (D) Expression variation distribution in xylem (533 genotypes) and leaf (470 genotypes) from publicly available RNA-Seq data (supplementary table S11, Supplementary Material online) for all P. trichocarpa genes with expression evidence, orphan genes are highlighted as red points.

