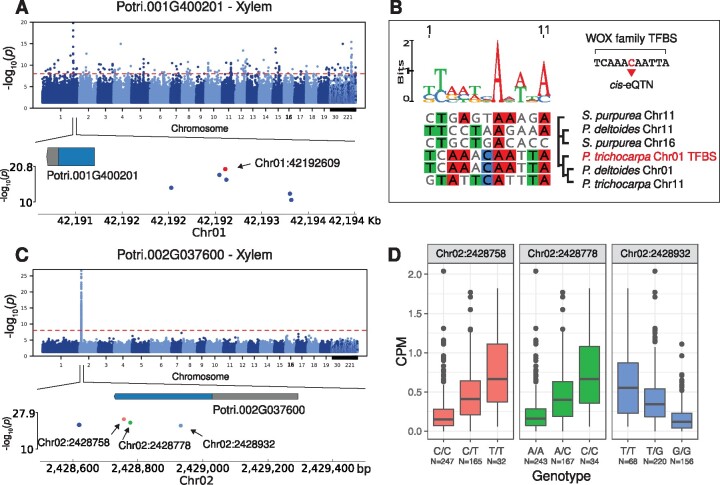
Fig. 4.
Cis-eQTL analysis facilitates assignment and reconstruction of probable proximal regulatory elements. (A) Potri.001G400201 Manhattan plot depicting the cis-eQTL interval, the red dot is the most significant SNP, with a significant match to a homeobox TFBS. (B) The reconstructed homeobox TFBS from the most significant SNP in Potri.001G400201’s cis-eQTL interval. (C) Potri.002G037600 Manhattan plot depicting the cis-eQTL interval, the three points within the exon are all nonsynonymous SNPs. (D) SNP effect on gene expression for Potri.002G037600, for three exonic SNPs, Chr02:2428758, Chr02:2428788, and Chr02:2428932.

