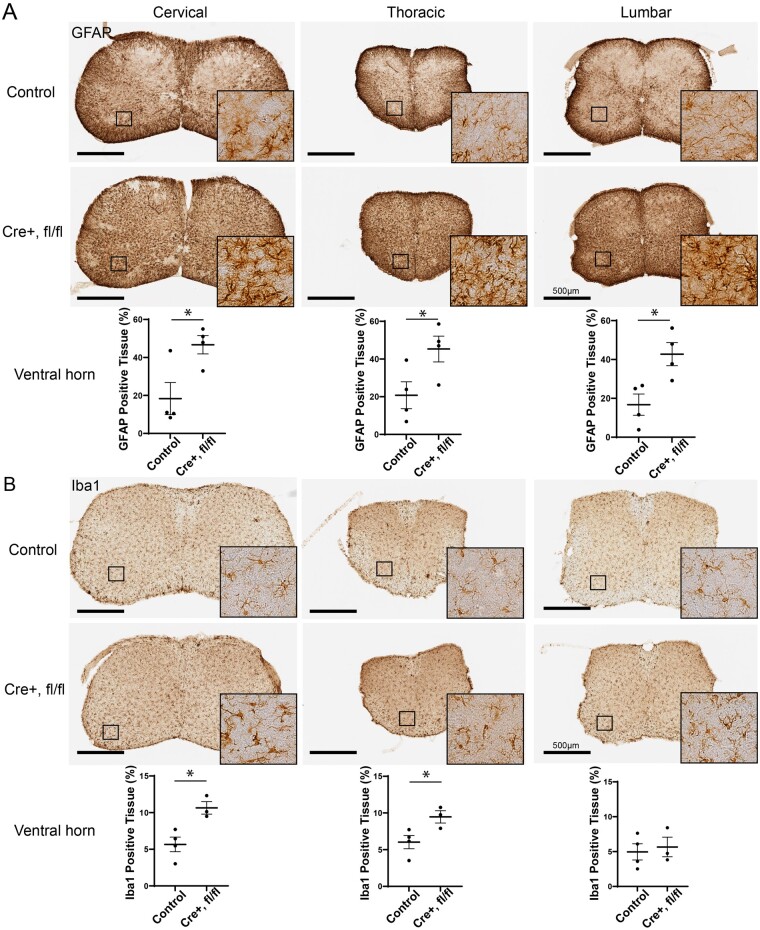
Figure 9.
Pronounced reactive gliosis in the spinal cord of VPS35 cKO mice crossed with Synapsin-1-Cre mice at P12–P14. (A, B) Immunohistochemical analysis of cervical, thoracic and lumbar spinal cord from VPS35fl/fl/Cre (n = 4 mice) or control (VPS35fl/fl, VPS35fl/wt or VPS35wt/wt/Cre; n = 4 mice) mice for the astrocyte marker, GFAP (A) or the microglial marker, Iba1 (B). High magnification images of individual glial cells within the spinal cord ventral horn are shown from the boxed regions (left), as indicated. (A, B) Graphs indicate quantitation of GFAP or Iba1 immunoreactivity within the ventral horn grey matter for each spinal cord region using HALO analysis software. Bars represent the mean ± SEM (n = 4 mice/genotype) sampled across three to six sections per animal, with GFAP- or Iba1-positive immunoreactivity expressed as a per cent of total tissue area analysed. *P < 0.05 by unpaired, two-tailed Student’s t-test. Scale bars: 500 μm.

