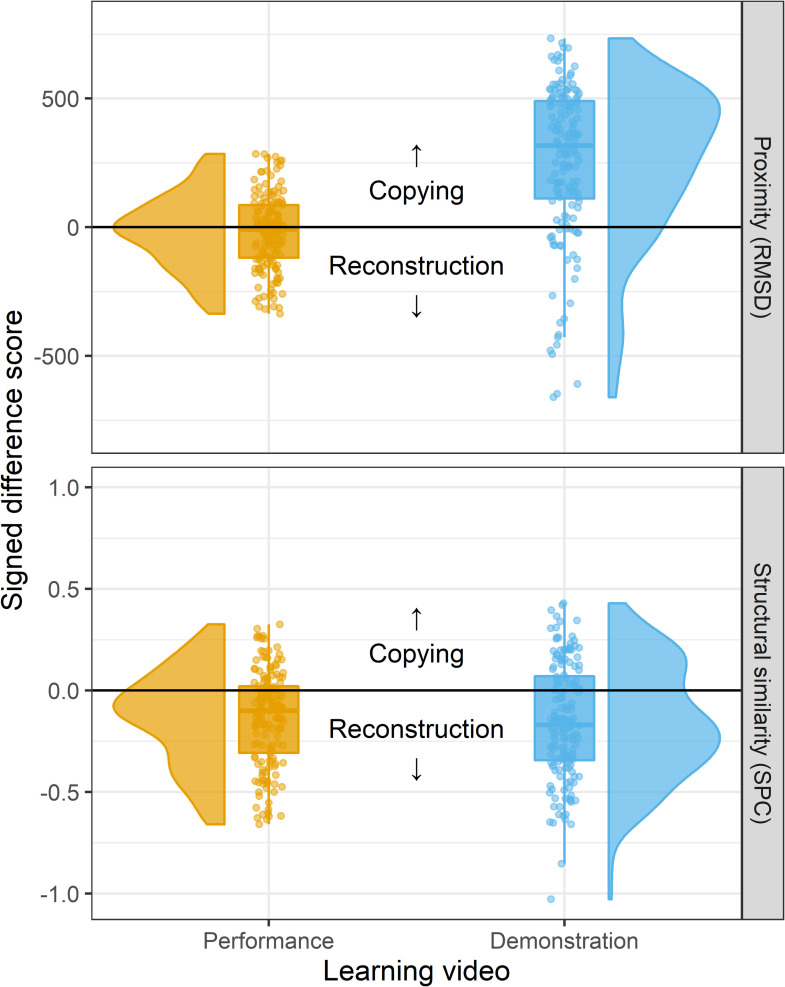
Fig 5. Raincloud plots showing the results of the proof-of-concept empirical study.
Points show signed difference scores between proximity (top) and similarity (bottom) metrics of each learner’s reproduction relative to the Learning and Original seeds, such that positive values indicate support for a copying process while negative values indicate support for reconstruction. Results are shown separately for Learning from Performance (orange, left) and Learning from Demonstration conditions (blue, right). Boxplots and half-violin plots show the distribution of difference scores.

