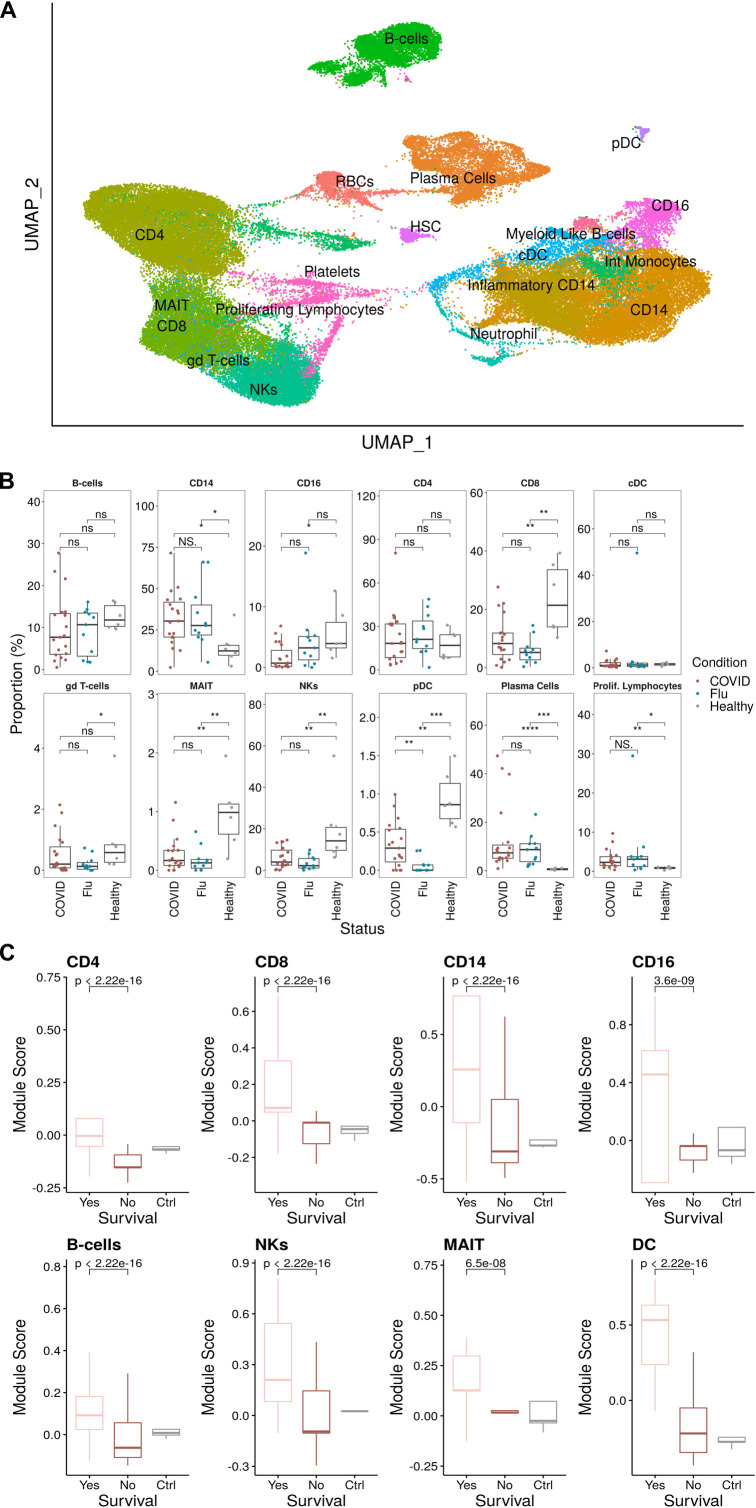
Fig 6. Elevated type I interferon signaling across multiple cell populations in critically ill COVID-19 patients who survive.
(A) UMAP projection of the scRNA-seq cohort consisting of 75,601 PBMCs (43,687 cells from COVID, 16,616 Healthy, and 15,298 Flu) colored by manually annotated cell types. (B) Relative cell proportions within each individual separated by disease condition. Statistical tests were conducted using the Wilcoxon rank-sum test between each condition. Summary values were subsequently displayed using the boxplot. The box is equivalent to the interquartile range (IQR) with the median as the center, and whiskers correspond to the 25th percentile—1.5x IQR or the lowest value, and 75th percentile +1.5x IQR or the highest value. (C) Type I IFN module scores for each major cell type compared between COVID survival and death with healthy controls as a reference. Significance was determined using the Wilcoxon test.

