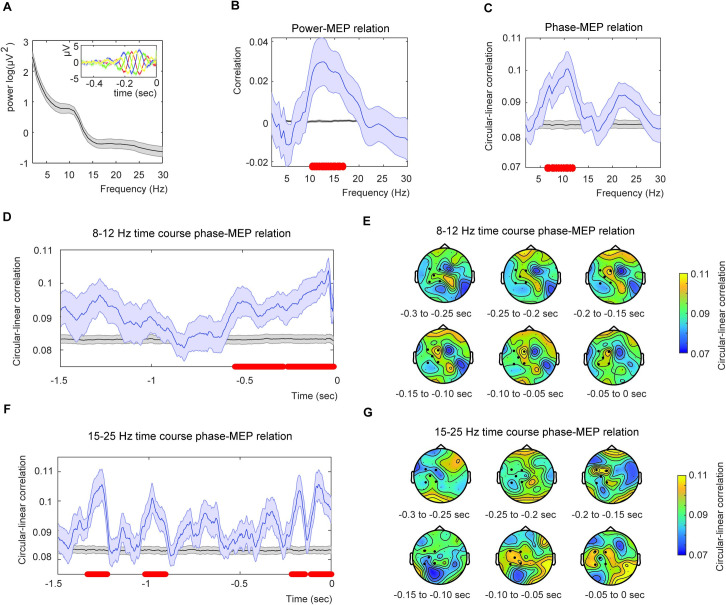
Fig 1. Results for the power and phase analysis.
A) Mean power averaged from the EEG channels C3, FC1, FC5, CP1 and CP5. The inset shows the (unfiltered) ERPs for four different equally spaced phase bins in channel CP1 for alpha. This figure demonstrates that there is no phase bias in our estimation. B) Averaged power-MEP correlation for the five selected channels (blue) and the average permutation (black). C) Average circular-linear phase-MEP correlation for the five selected channels (blue) and the related permutation (black). Red dots indicate significance at alpha = 0.05 (cluster corrected). D) Phase-MEP relation extracting the instantaneous alpha phase via the Hilbert transform displaying the time course of the effect. Color coding identical to C). E) Phase correlation topography based on the Hilbert analysis. The strongest correlation was present at CP1. All shaded areas indicate the standard error of the mean. F) and G) are identical to D) and E) but for the beta frequency range (15–25 Hz).

