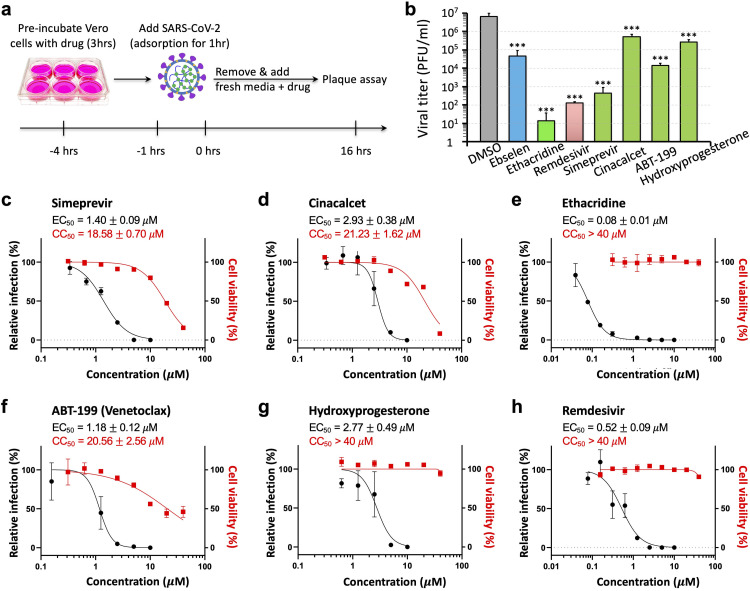
Fig 3. Antiviral activities of the identified drugs against SARS-CoV-2.
(a) Schematic showing the experimental design, see Methods for details. (b) Quantitative analysis of viral titer from plaque assays on Vero E6 cells treated with each drug at 5 μM. Data are mean ± SEM (n = 3). *** p < 0.001. (c–h) Dose-response and cell-toxicity curve of each drug against SARS-CoV-2 by plaque assays. The percentage of relative infection was determined by the ratio of infection rate of SARS-CoV-2 treated with each drug divided by that of DMSO control. EC50 and CC50 are represented as mean ± SEM (n = 3).

