
Figure 2.
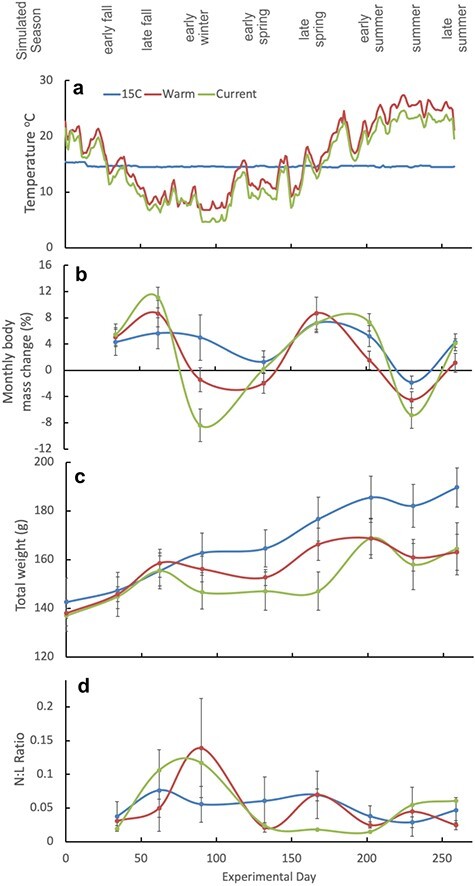
Simulated climatic variations in temperature in relation to changing body mass and N:L ratios. (a) Experimental seasonal conditions applied to the three treatment groups (simulated current season, simulated warming seasons and 15°C control no seasonal variation). Lower panels show means of each treatment group (n = 6 animals) ±standard error for growth as measured by the following: (b) monthly body mass change (%), (c) total weight and (d) N:L ratio.