Fig. 3.
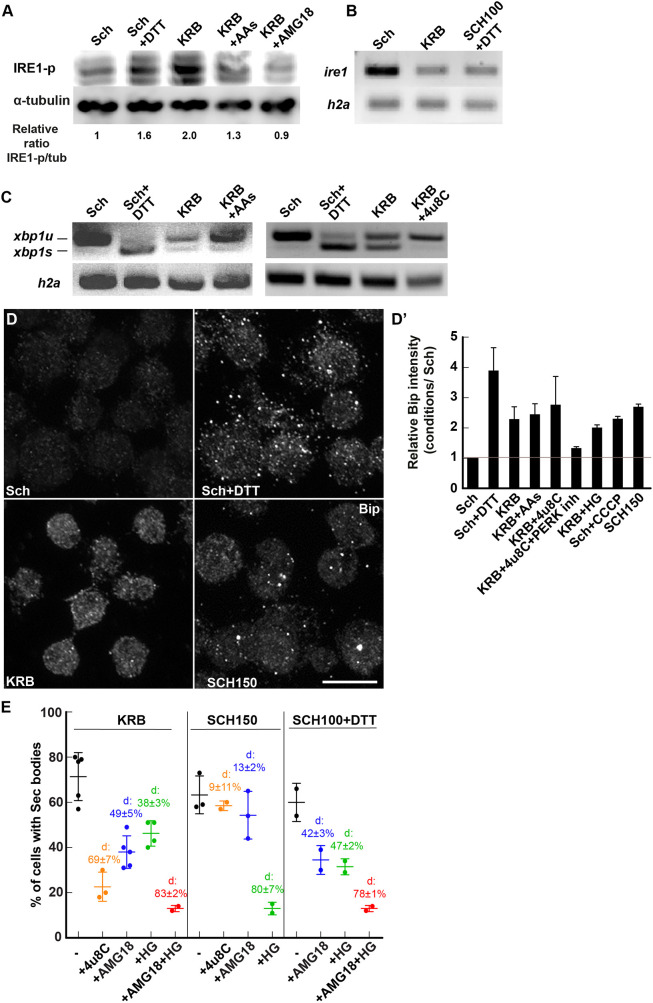
KRB incubation activates IRE1. (A) Western blot visualization of IRE1-p (using the anti IRE1-p antibody, Genentech) in cells in Schneider's medium (Sch), Sch+DTT (5 mM), KRB, KRB+amino acids (AAs) (5 mM) and KRB+AMG18 (10 µM) for 4 h after blotting. Note that KRB incubation elicits IRE1-p more strongly than Sch+DTT, and that addition of AAs to KRB partially reverses this phosphorylation. Addition of the IRE1 kinase attenuator AMG18 (10 µM) strongly inhibits IRE1-p formation. Quantification underneath is the ratio of IRE1-p (middle band) to α-tubulin for the blot shown. (B) Visualization of the PCR products of ire1 and h2a mRNAs from cells incubated in Sch, KRB and SCH100+DTT for 4 h at 26°C. (C) Visualization of spliced (xbp1s) and unspliced (xbp1u) PCR products of xbp1 upon conditions indicated on the panel. (D,D′) Immunofluorescence visualization (D) of the protein Bip in cells incubated in the conditions indicated on the panel. Quantification is in D′. Note that the UPR is stimulated in KRB and many other conditions. (E) Quantification of Sec body formation (marked by Sec16) in cells incubated in KRB, SCH150 or SCH100+DTT with or without 4u8C (30 µM), AMG18 (10 µM), HG (5 µM) or AMG18+HG. ‘d’ indicates the mean±s.e.m. decrease in Sec body formation when compared to the absence of inhibitors. P-value (SCH150 and SCH150+AMG18) is 0.104 and the P-value (KRB and KRB+HG) is 0.0019. The other differences are highly significant (<10−4). Errors bars: s.e.m. Scale bar: 10 µm.

