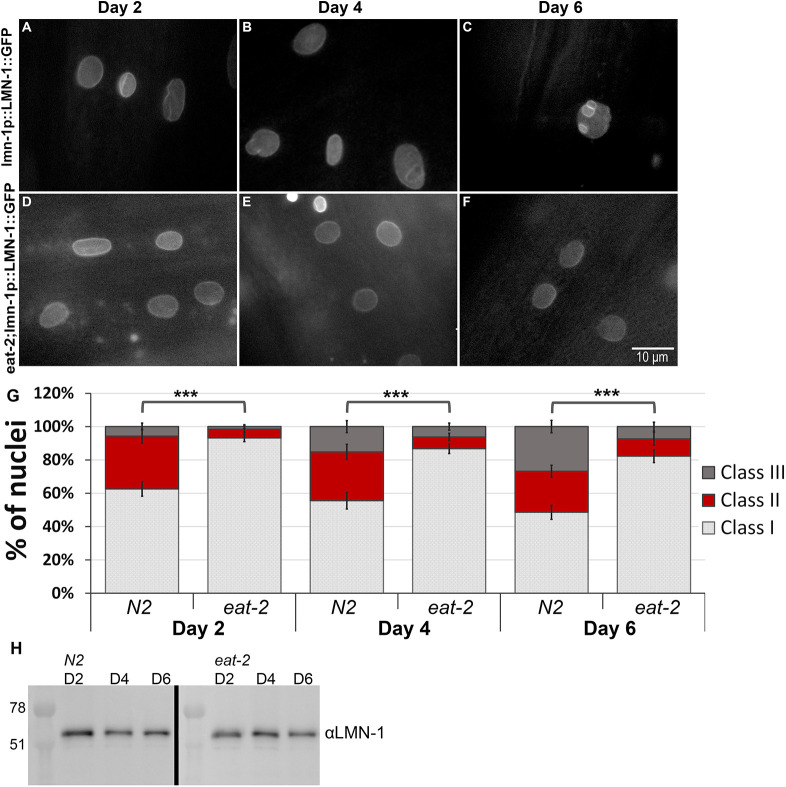
Fig. 5.
Dietary restrictions delay age-dependent nuclear deformation. (A–F) Representative microscope images of control (N2) (A–C) and eat-2 (D–F) worms expressing LMN-1::GFP at days 2 (A,D), 4 (B,E) and 6 (C,F) of adulthood. (G) Relative distribution of the three different classes grading (see Materials and Methods) the nuclear morphology changes in N2 and eat-2 animals at days 2, 4 and 6 of adulthood. n(D2)=255 nuclei, n(D4)=228 nuclei, n(D6)=238 nuclei. Note: Error bars in all graphs represent mean±s.e.m. ***P<0.0001 (Fisher exact probability test). (H) Western blot gel image of LMN-1 protein in N2 and eat-2 at days 2, 4 or 6 of adulthood.

