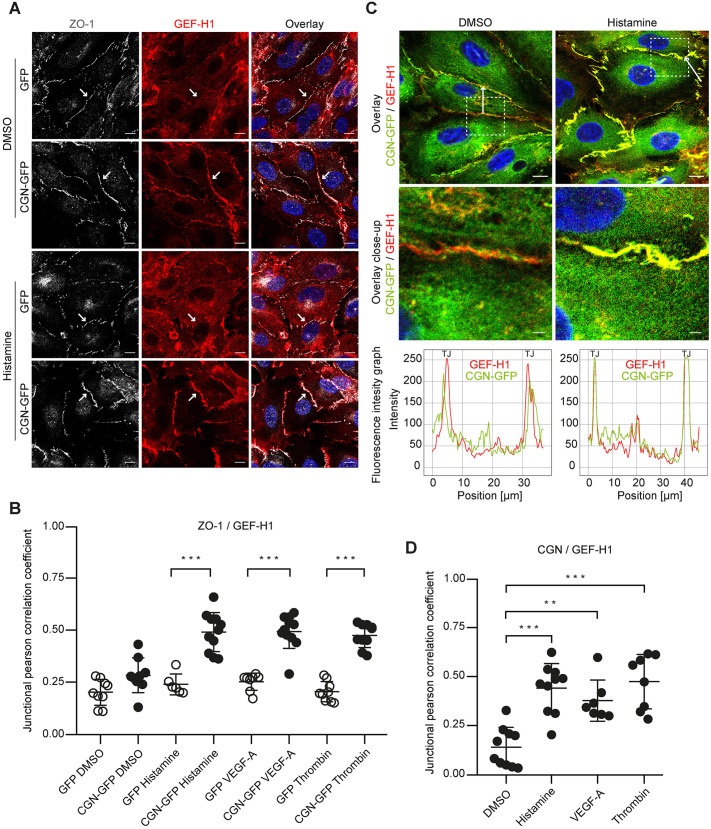
Fig. 4.
GEF-H1 and ZO-1 colocalisation after stimulation is cingulin dependent. (A) Cingulin-overexpressing (CGN-GFP) and control cells (GFP) were stained for ZO-1 (grey) and GEF-H1 (red) after stimulation with histamine (10 μg/ml) for 15 min. Nuclei were stained with DAPI (blue). Arrows highlight junctional localisation of GEF-H1. Scale bars: 10 μm. (B) The colocalisation of ZO-1 and GEF-H1 was quantified by determining junctional correlation coefficients. (C) Top, CGN-GFP (green) cells were stained for GEF-H1 (red) after 15 min of histamine (10 μg/ml) stimulation. Nuclei were stained with DAPI (blue). Scale bar: 10 μm. Immunofluorescence intensity was quantified along the white arrow. Middle, magnified view of indicated area in the top images. Scale bars: 2 μm. Bottom, immunofluorescence intensity graphs are shown for cingulin (green) and GEF-H1 (red) for the position denoted by the arrow. (D) Corresponding junctional correlation coefficients indicate the colocalisation of cingulin and GEF-H1 in CGN-GFP cells after 15 min stimulation with histamine (10 μg/ml), VEGF-A (50 ng/ml) or thrombin (0.5 U/ml). Data are presented as the mean±s.d. *P<0.05, **P<0.01, ***P≤0.001 (one-way ANOVA with Tukey's post-hoc test).

