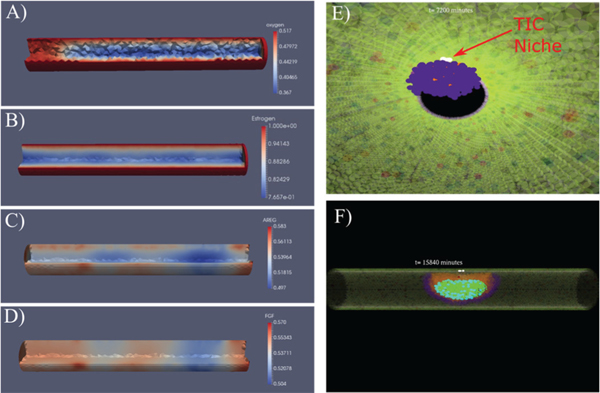
Fig. 2.
Examples of continuum (A−D) and discrete (E, F) model components. Continuum solutions from FEM within an idealized mammary gland duct are shown for A) oxygen, B) estrogen, C) AREG, and D) FGF. Oxygen enters into the duct from the boundary under Dirichlet conditions; regions shown in blue are where DCIS has reduced the local oxygen conditions. C, D) AREG is produced in the duct by ER+ cells (red: high concentrations; indicates localized AREG production) and diffuses throughout the domain and out of the duct radial boundary. The FGF boundary condition is derived from the AREG solution. E) Internal view of DCIS five days after DCIS initiation (viewpoint: inside the duct cavity looking parallel to the duct central axis); the TIC niche is shown in white (red arrow), with a growing DCIS mass (purple) seen encroaching into the duct cavity away from the TIC niche. F) An example view of DCIS 11 days after DCIS initiation; the mature duct cells and healthy DCIS progenitors are shown as transparent so the stem phenotype, as well as hypoxia and calcification internal to the DCIS may be seen clearly. A−D: 100 μm diameter duct; E, F: 200 μm diameter duct (shown for ease of visibility); all agent colors are as shown in Fig. 1C.

