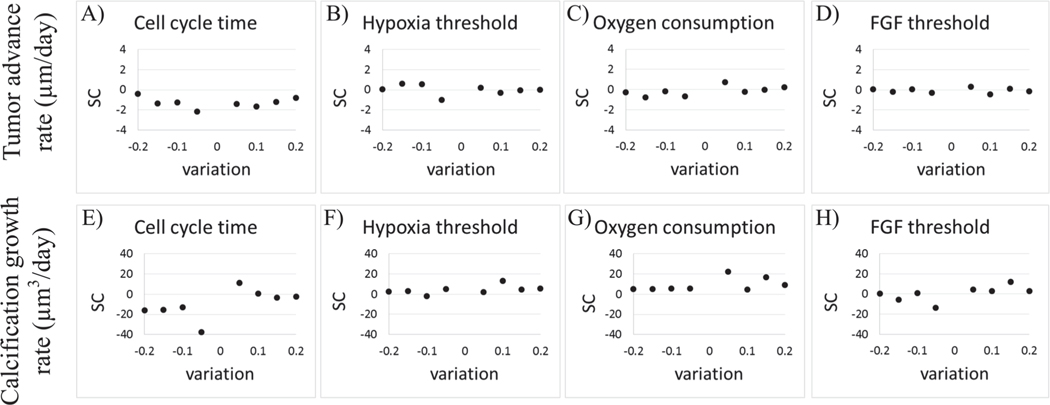
Fig. 5.
Sensitivity coefficient under parameter perturbation. We analyzed model sensitivity to perturbations in A,E) cell cycle time (), B,F) hypoxia threshold (θH), C,G) oxygen consumption (), and D,H) FGF sensitivity threshold. Model responses to parameter perturbations were quantified base on the changes in A−D) tumor axial invasion rate and E−H) calcification growth rate. Model sensitivity was calculated using a sensitivity coefficient (SC), which quantifies change in model output per change in model input parameter (see Equation (6)).

