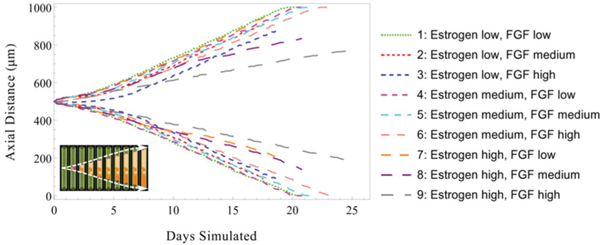
Fig. 7.
Effects of molecular signaling thresholds on DCIS axial extent. Plot shows the location of the leading edge of the DCIS mass along both axial directions (indicated by upper and lower curve pairs, as shown by white dashed lines in inset, bottom left) under various molecular signaling sensitivity thresholds. Increased molecular signal thresholds for estrogen and FGF resulted in reduced DCIS axial invasion, with high thresholds for both simultaneously showing the most pronounced effect. All results shown are for a 100 μm diameter duct. Case 1 provides a baseline (i.e., with only minimal thresholding effects). Thresholding is implemented using normalized molecular concentrations (1.0 estrogen baseline, with low = 0.8, medium = 0.85 and high = 0.9, and FGF 0.5 baseline low = 0.3, medium = 0.4, and high =0.5). Additional details are shown in Supplemental Materials Fig. S2.

