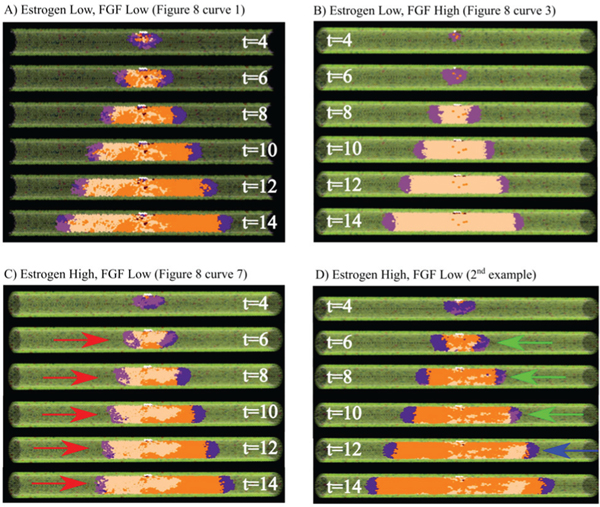
Fig. 8.
Example simulation results with signaling effects. A) Baseline example without signaling limited proliferation, presented as a cross-section to show the inner phenotype distribution within the DCIS (times shown in days). B) FGF limited proliferation case: the ER− population is completely unable to proliferate at early model times, resulting in the viable rim being completely composed of ER+ cells, resulting in almost the entire DCIS population being an ER+ phenotype. C, D) Estrogen-limited case examples. C) The ER+ viable rim (red arrows) is seen to advance more slowly than the ER− (right side) viable rim due to estrogen limited ER+ proliferation. D) In another simulation instance under the same simulation conditions as C), a mixed viable rim (green arrows at t = 6, 8, 10 days) is seen to overcome the proliferation limited ER+ population (due to high estrogen threshold), resulting in an ER+ viable rim (blue arrow, t = 12 days) and demonstrating a possible adaptation mechanism to signaling limited cases in the DCIS cancer population. All results shown in a 100 μm duct; cases A–C correspond to curves shown in Fig. 8 (as indicated), with agent color scheme as shown in Fig. 1C and 7A.

