. 2021 Sep 2;10:e65528. doi: 10.7554/eLife.65528

Figure 4. Ascorbic acid medium supplementation is required for hematopoietic stem and progenitor cell-derived plasmacytoid dendritic cell (HSPC-pDC) generation using the current good manufacturing process (cGMP)-compliant DC medium.

HSPCs were thawed and 1 × 10⁵ cells were seeded in SFEM II, the cGMP-compliant medium DC medium (GMP [DC]), or DC medium supplemented with ascorbic acid (GMP [DC] + AA). For all conditions, cells were kept at a density of 0.5–5 × 10⁶ cells/mL throughout culture. HSPC-pDCs were isolated after 16 and 21 days of culture and phenotypically analyzed. (a) Calculated number of total cells during HSPC-pDC differentiation. (b) Calculated number of HSPC-pDCs after isolation at 16 days or 21 days of culture. (c) Percentage of HSPC-pDCs of total cells. (d, e) Type I interferon (IFN) response of IFN primed or unprimed HSPC-pDCs isolated after 16 or 21 days of culture after activation with the TLR7 agonist R837 (d) or the TLR9 agonist CpG-2216 (e). Data shown represent ± SEM of four donors (a–c) and ± SEM of four donors each analyzed in technical triplicates (d, e).

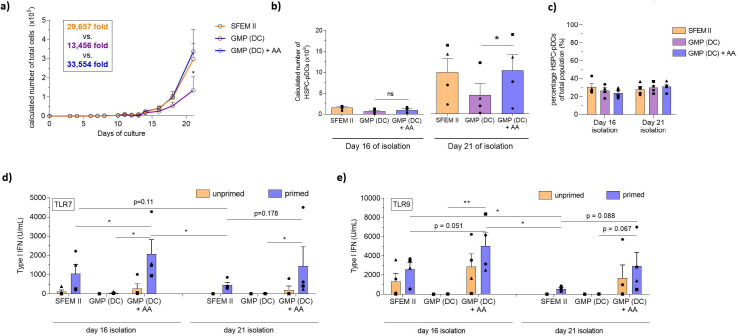
Figure 4—source data 1. Source data related to Figure 4a-e.

Figure 4.

Figure 4—figure supplement 1. cGMP compliant mediums fails to produce functional hematopoeitic stem and progenitor cell-derived plasmacytoid dendritic cells (HSPC-pDCs).

Figure 4—figure supplement 1.

(a–g) 1 × 10⁵ HSPCs were cultured in SFEM II, the current good manufacturing process (cGMP)-compliant DC medium (GMP [DC]), or the cGMP-compliant SCGM (GMP [SCGM]). For all conditions, cells were kept at a density of 0.5–5 × 10⁶ cells/mL throughout culture. HSPC-pDCs were isolated after 21 days of culture and phenotypically and functionally analyzed. (a) Calculated number of cells during HSPC-pDC differentiation. (b) Viability of cells during HSPC-pDC differentiation. (c) Calculated number of isolated HSPC-pDCs after 21 days of culture. (d) Percentage of HSPC-pDCs of total cells. (e) Viability of isolated HSPC-pDCs. (f) Representative flow cytometry plots showing the expression of CD123 versus CD303 on lin-CD11c- cells for HSPC-pDCs isolated at day 16 from the different culture conditions. (g) Type I interferon (IFN) response of HSPC-pDCs after stimulation with the TLR7 agonist R837 or the TLR9 agonist CpG-2216.Data shown are for one donor (a–f), ± SD of technical replicates from one donor (g).
Figure 4—figure supplement 1—source data 1. Source data related to Figure 4-figure supplement 1a-e and g.
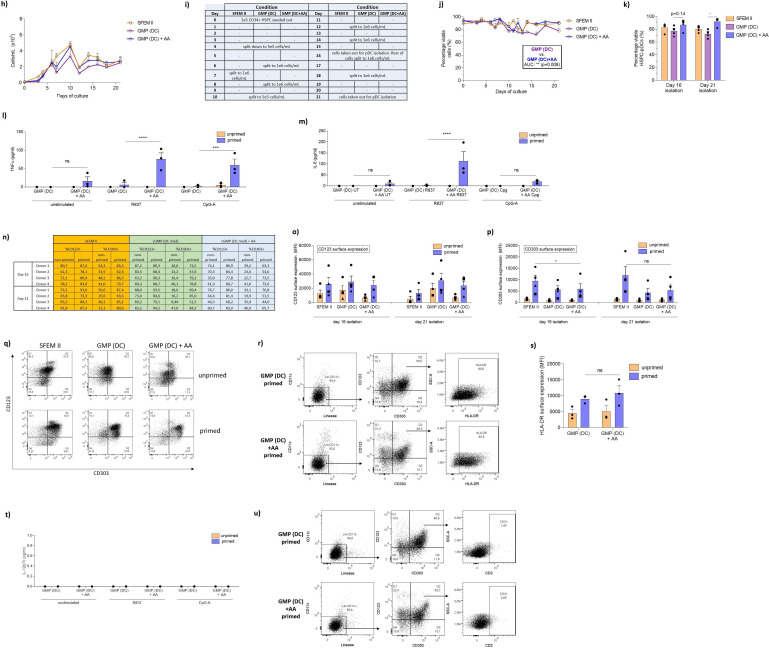
Figure 4—figure supplement 2. Ascorbic acid is required for generation of functional hematopoietic stem and progenitor cell-derived plasmacytoid dendritic cells (HSPC-pDCs) with DC medium.

Figure 4—figure supplement 2.

(h–o) HSPC-pDCs were generated using either SFEM II, the cGMP-compliant medium DC medium (GMP [DC]), or DC medium supplemented with ascorbic acid (GMP [DC] + AA). For all conditions, cells were kept at a density of 0.5–5 × 10⁶ cells/mL throughout culture. HSPC-pDCs were isolated after 16 and 21 days of culture and phenotypically analyzed. (h) Density of cells throughout pDC differentiation prior to medium change. (i) Table showing the days where cells were split to a new density (0.5–2 × 10⁶ cells/mL). (j) Viability of cells during HSPC-pDC differentiation. (k) Viability of HSPC-pDCs isolated after 16 or 21 days of culture. (l, m) Unprimed or primed HSPC-pDCs generated using GMP (DC) or GMP (DC) + AA were activated with TLR7 or TLR9 agonists. 20 hr later, supernatants were collected and levels of TNFα (l) or IL6 (m) were analyzed. (n) Table showing the percentage of isolated HSPC-pDCs expressing CD123 and CD303. (o, p) Surface expression levels of CD123 (o) or CD303 (p) for primed or non-primed HSPC-pDCs. (q) Representative flow cytometry plots showing the expression of CD123 versus CD303 on lin-CD11c- cells for HSPC-pDCs isolated at day 16 from the different culture conditions. (r–u) HSPC-pDCs were generated using either the DC medium (GMP [DC]) or the GMP (DC) supplemented with ascorbic acid (GMP [DC] + AA). (r) Representative flow plot showing expression of HLA-DR on primed HSPC-pDCs. (s) Surface expression levels of HLA-DR on IFN primed and unprimed HSPC-pDCs. (t) IL-12 response of unprimed or IFN-primed HSPC-pDCs upon stimulation with the TLR7 agonist R837 or the TLR9 agonist CpG-A. (u) Representative flow cytometry plots showing expression of CD2 on primed HSPC-pDCs. Data shown ± SEM of four donors (h-k and n–q), ± SEM of three donors (l, m and r–u).
Figure 4—figure supplement 2—source data 1. Source data related to Figure 4—figure supplement 2h, j-m,- o-p and s-t.