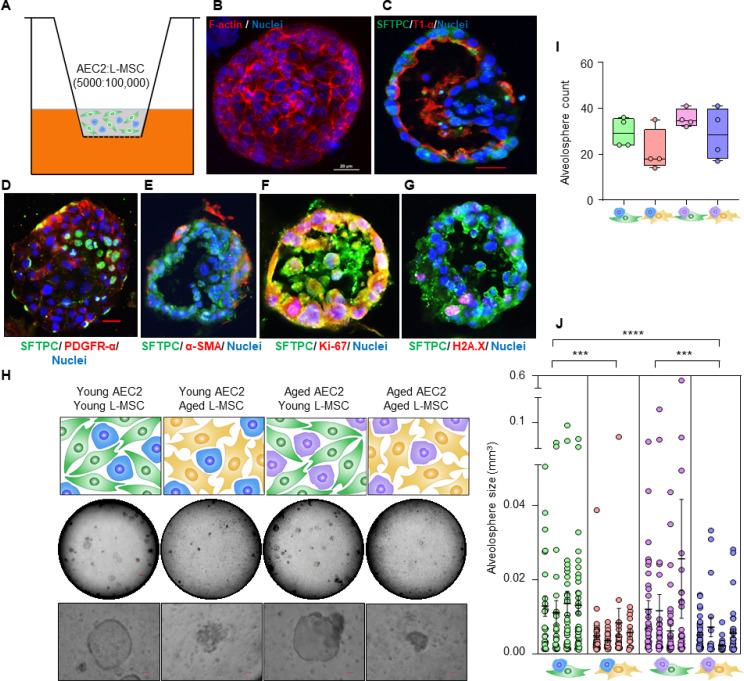
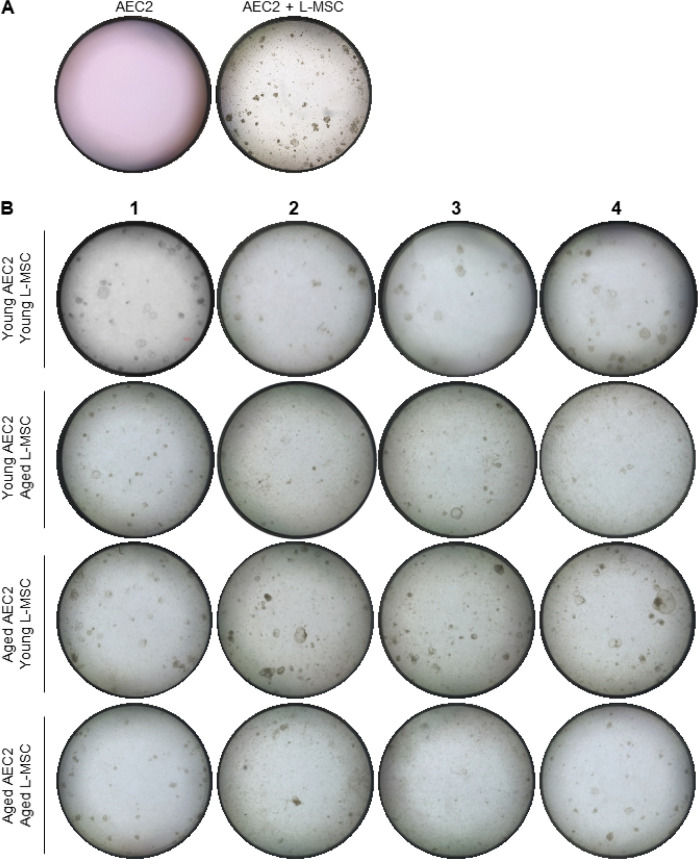
Figure 1. Aging lung-mesenchymal stromal cells (L-MSCs) impair self-organization of alveolar epithelial stem cells (AEC2s) and alveolosphere formation.
(A) Alveolosphere assay. AEC2s and L-MSCs were purified from the young (3 months) mice lungs. AEC2s (5000 cells/well) and L-MSCs (100,000 cells/well) were mixed and seeded in Matrigel: MTEC plus media (1:1) and co-cultured in cell-culture inserts in 24-well dishes as shown. Alveolospheres form within 9–12 days of co-culture. (B) Alveolosphere whole mounts were immunofluorescently stained with antibody against F-actin (red) for confocal imaging. Image showing maximum intensity projection of an alveolosphere (scale bar = 20 µm). (C) Immunofluorescence (IF) staining showing localization of AEC2s (surfactant protein-C [SFTPC], green) and AEC1s (lung type I integral membrane glycoprotein-α [T1-α], red) within the alveolospheres. (D) IF staining showing localization of platelet-derived growth factor receptor-α (PDGFR-α, red) expressing alveolar L-MSCs within the alveolospheres. (E) Alpha-smooth muscle actin (α-SMA, red) IF staining showing presence of myofibroblasts in the alveolosphere. (F, G) Cell proliferation and DNA repair/apoptosis within the alveolospheres were determined by Ki-67 (F; red) and histone H2A.X (G; red) IF staining, respectively. Nuclei were stained with Hoechst 33,342 (blue; scale bars = 20 µm). (H) L-MSCs and AEC2s from young (3 months) and aged mice (24 months) were co-cultured in varied combinations as shown (upper panel); alveolospheres were imaged by brightfield microscopy. Images at low and high magnifications are shown (middle panel, scale bar = 300 µm; lower panel, scale bar = 20 µm). (I) Alveolospheres in each well were counted (n = 4 mice); box and whiskers plot showing median alveolosphere count in each group (p>0.05; ANOVA; Tukey’s pairwise comparison test). (J) Alveolosphere sizes (volumes) were determined for each of the co-culture groups using ImageJ v1.47 software. Nested scatterplot showing mean ± SEM of all the alveolospheres counted in each well for each group (n = 4 mice; ***p<0.001, young AEC2s:young L-MSCs vs. young AEC2s:aged L-MSCs; aged AEC2s:young L-MSCs vs. aged AEC2s:aged L-MSCs; ****p<0.0001, young AEC2s:young L-MSCs vs. aged AEC2s:aged L-MSCs; ANOVA followed by Tukey’s pairwise comparison test).


