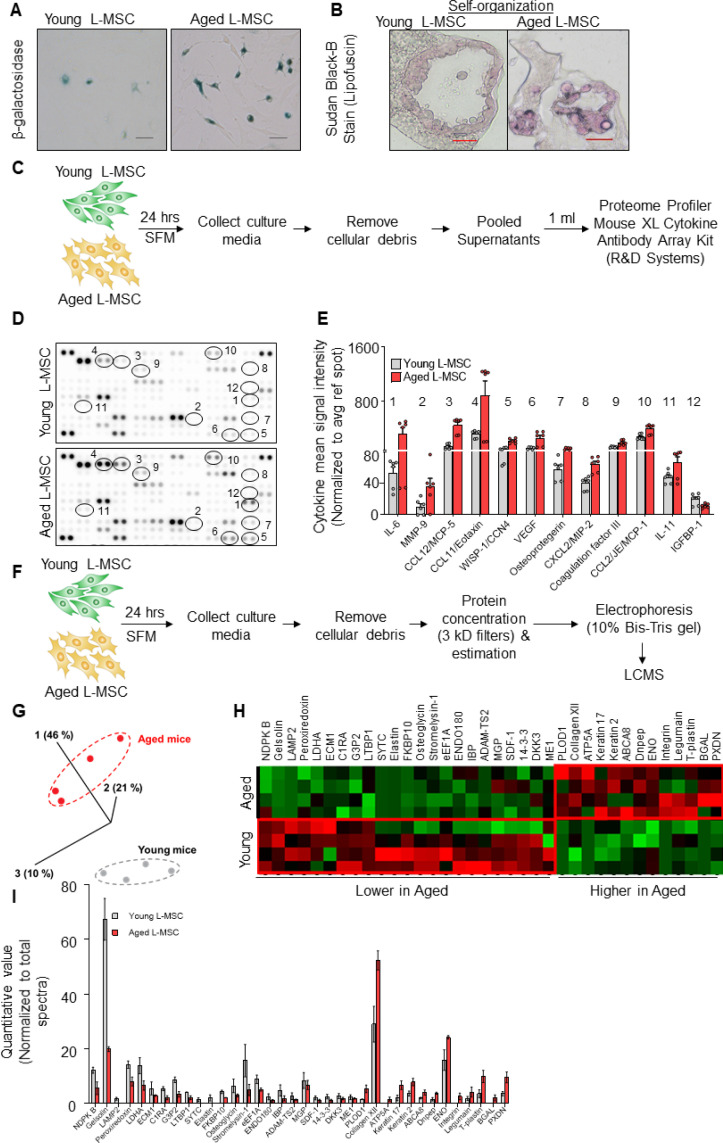
Figure 2. Aged lung mesenchymal stromal cells (L-MSCs) show redox imbalance and acquire senescence-associated secretory phenotype.
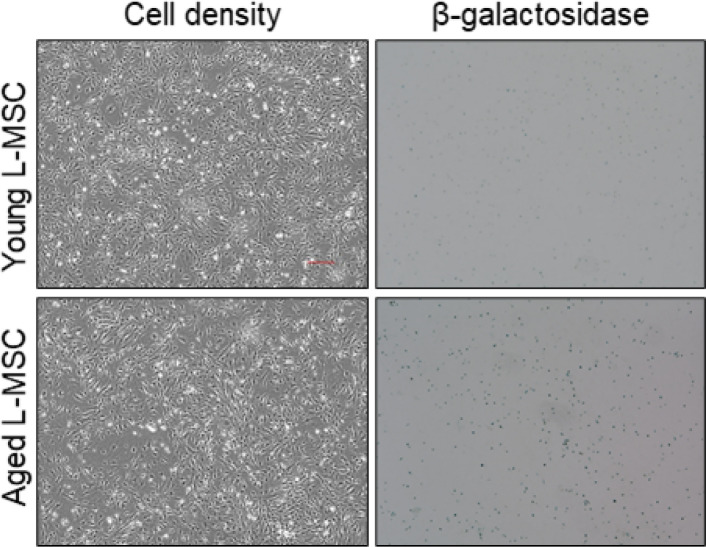
(A) β-Galactosidase activity assay. Young and aged L-MSCs were plated in 6-well dishes at a density of 150,000 L-MSCs/well. L-MSCs were allowed to attach overnight and stained for β-galactosidase activity (scale bar = 50 µm). (B) Lipofuscin granules were detected in the alveolosphere paraffin sections by Sudan Black B staining. Sections were also stained with nuclear fast red for contrast (scale bar = 20 µm). (C) Cytokine array. 150,000 young and aged L-MSCs were plated in each well of a 6-well culture dish and grown overnight. Cells were washed with PBS and cultured for 24 hr in serum-free media (SFM; 1.5 ml/well). The culture media were pooled for each cell type and centrifuged to remove any cell and debris. 1 ml of supernatant was applied to antibody array, dotted with antibodies against 111 mouse cytokines and growth factors in duplicates. (D) Antibody array showing comparative expression of cytokines and growth factors in the culture media obtained from young and aged L-MSCs. Cytokines and growth factors showing significant difference are numbered and circled. (E) Signal intensity was determined for each dot using Image Quant array analysis software; mean signal intensity was calculated for each cytokine, and plotted. Twelve proteins with statistically significant difference (n = 6 samples from three mice; p<0.05; unpaired t-test) between the young and aged L-MSCs are shown. Data presented here include pooled data from three independent experiments. (F) Proteomics/mass spectrometry analysis. Cell culture media were collected from young and aged L-MSCs (106 cells) after 24 hr of growth in SFM in 10 cm dishes and subjected to proteomics analysis by liquid chromatography-mass spectrometry (LCMS). (G) A three-dimensional principal component analysis (PCA) plot showing replicated samples (young and aged) are relatively similar in their protein expression profiles and grouped together. (H) Heat map showing comparative expression of highly secreted proteins in the culture media between young and aged L-MSCs (n = 4 mice). (I) The top 36 proteins showing statistically significant difference (n = 4 mice; p<0.05; unpaired t-test) between the young and aged L-MSC secretome are plotted. Gene ontology, processes, and network analyses were performed on the mass spectrometry data, and results are provided in Supplementary file 1.


