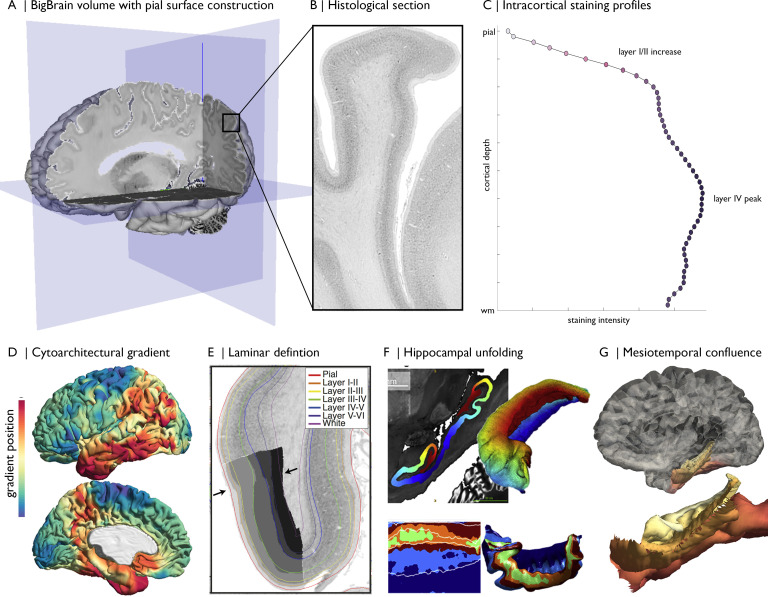
Figure 1. Magnification of cytoarchitecture using BigBrain, from (A) whole brain 3D reconstruction (taken on https://atlases.ebrains.eu/viewer) to (B) a histological section at 20 µm resolution (available from bigbrainproject.org) to (C) an intracortical staining profile.
The profile represents variations in cellular density and size across cortical depths. Distinctive features of laminar architecture are often observable i.e., a layer IV peak. Note, the presented profile was subjected to smoothing as described in the following section. BigBrainWarp also supports integration of previous research on BigBrain including (D–E) cytoarchitectural and (F–G) morphological models (DeKraker et al., 2019; Paquola et al., 2020a; Paquola et al., 2019; Wagstyl et al., 2020).

