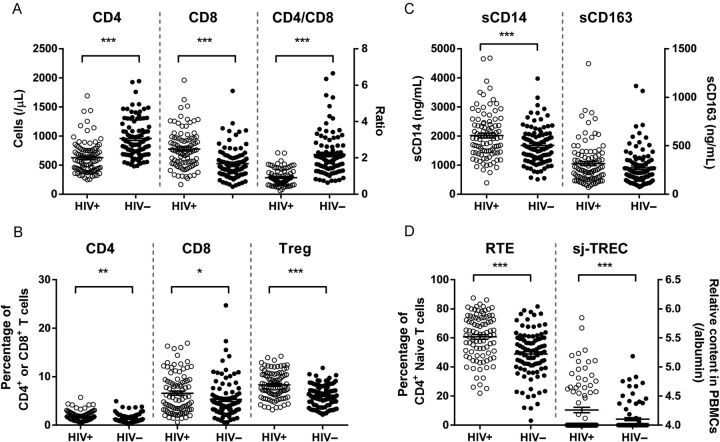
Figure 1.
T-cell phenotyping and immune activation in human immunodeficiency virus type 1 (HIV)–infected antiretroviral therapy (ART) recipients and uninfected controls. A, Absolute CD4+ T-cell counts, absolute CD8+ T-cell counts, and ratios of CD4+ to CD8+ T cells are shown for HIV-infected ART recipients and uninfected controls. B, T-cell activation was determined by the percentage of HLA-DR+CD38+ cells within the total CD4+ and CD8+ T-cell population, and the percentage of regulatory T cells (Tregs) was determined by the analysis of the proportion of CD4+CD25+CD127low cells among the CD4+ T cells. C, Monocyte activation and microbial translocation were determined by measuring soluble CD14 (sCD14) and soluble CD163 (sCD163) levels in plasma. D, Thymic output was determined by the proportion of CD31+ naive CD4+ T cells and single-joint T-cell receptor excision circle (sjTREC) content in peripheral blood mononuclear cells (PBMCs).

