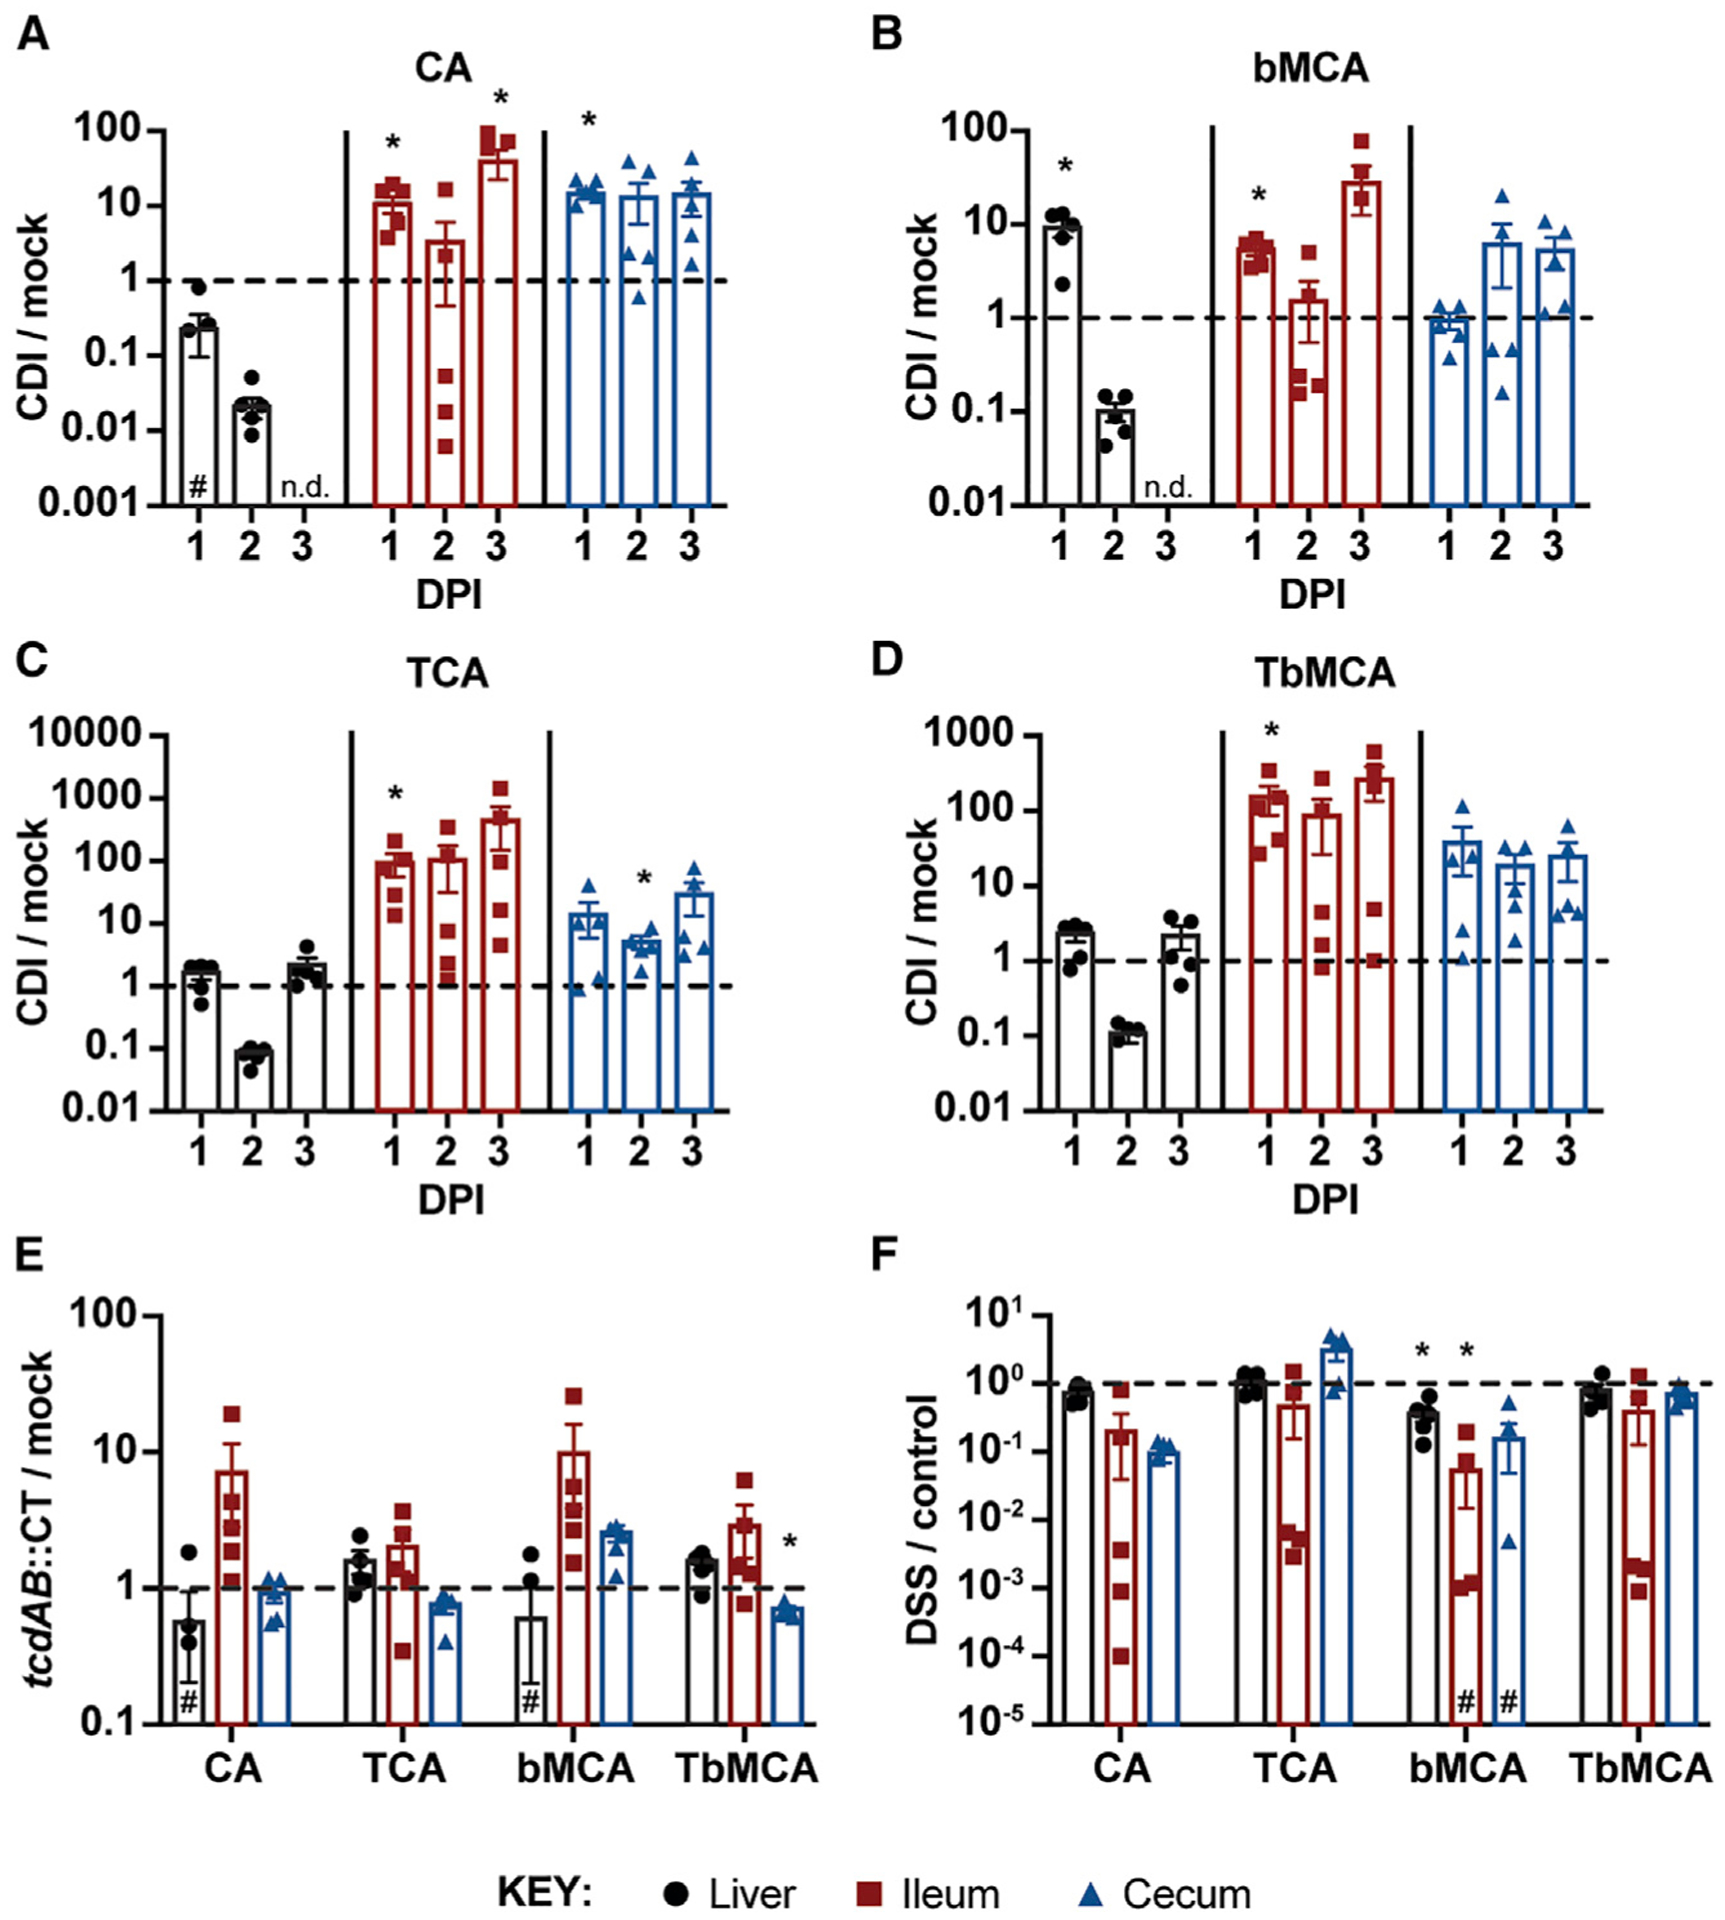
Figure 2. CDI induces a rapid influx of primary bile acids into the gut in a manner dependent on C. difficile toxins but independent of inflammation.

(A–D) Ratios of unconjugated (A and B) and taurine-conjugated (C and D) primary bile acids in the liver, ileum, and cecum of CDI versus mock-infected mice.
(E) Ratios of primary bile acids in the liver, ileum, and cecum of toxin-deficient (tcdAB::CT) versus mock-infected mice at 3 DPI.
(F) Ratios of primary bile acids in the liver, ileum, and cecum of DSS-treated versus untreated control mice after 2 days of treatment. Concentrations are adjusted based on sample weight (μM/g) prior to calculating LC-MS/MS-based ratios.
Data are represented as mean ± standard error of the mean (SEM); DPI, days post-infection; n.d., not detected in CDI mice; #, not detected in all mice; *p < 0.05, significance determined by unpaired two-sided t tests; n = 5 mice/group.
