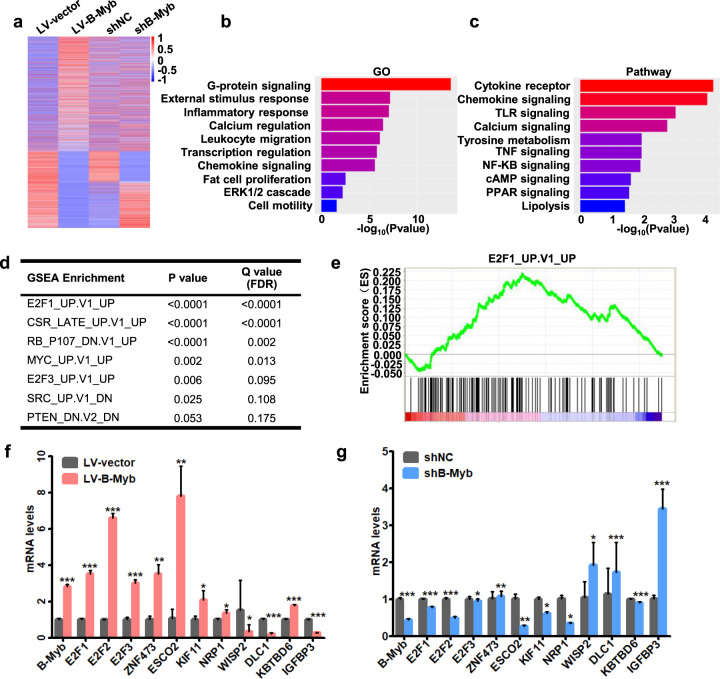
Fig. 5. Identification of signaling pathways and oncogenic signatures correlated with B-Myb.
a RNA-seq analyses for stable B-Myb overexpression and knockdown HCT116 cells. Heatmap shows the differentially expressed genes. b, c GO enrichment and KEGG pathway analysis based on the differentially expressed genes between the stable B-Myb overexpression (LV-B-Myb) and its control (LV-vector) HCT116 cells. d Top enriched gene sets by GSEA analysis. False discovery rate, FDR. e GSEA plot showing that the B-Myb-regulated genes correlate with E2F1 gene signatures (E2F1_UP.V1_UP). f, g Verification of important B-Myb-regulated downstream genes by qRT-PCR. Data represent the mean ± SD. *p < 0.05, **p < 0.01, ***p < 0.001.

