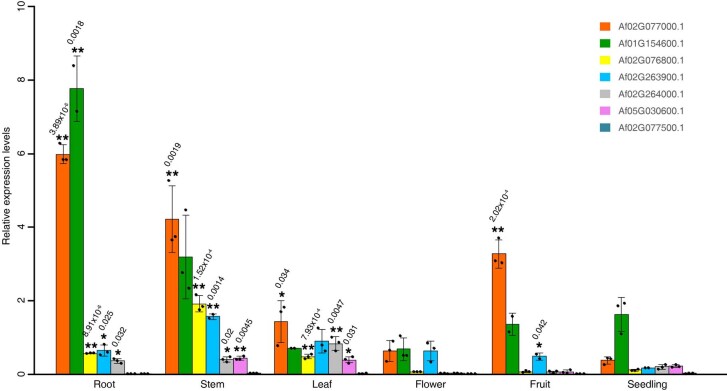
Extended Data Fig. 10. Gene expression quantification by qRT–PCR for the seven NCSI genes in A. fimbriata.
All data are presented as the means ± s.d. (n = 3 biological replicates, as shown in solid black dots). The NCSI gene expression levels in five other tissues (root, stem, leaf, flower, and fruit) were compared with that in seedlings, and the two-tailed t tests were used to analyse the statistical significance of their expression levels. * indicates a significant difference at P value < 0.05, and ** indicates a significant difference at P value < 0.01, P values are shown above each bar chart.

