
Figure 5: Cross-housing of mice repeatedly demonstrates the strength of the motility and lacI allele combination.
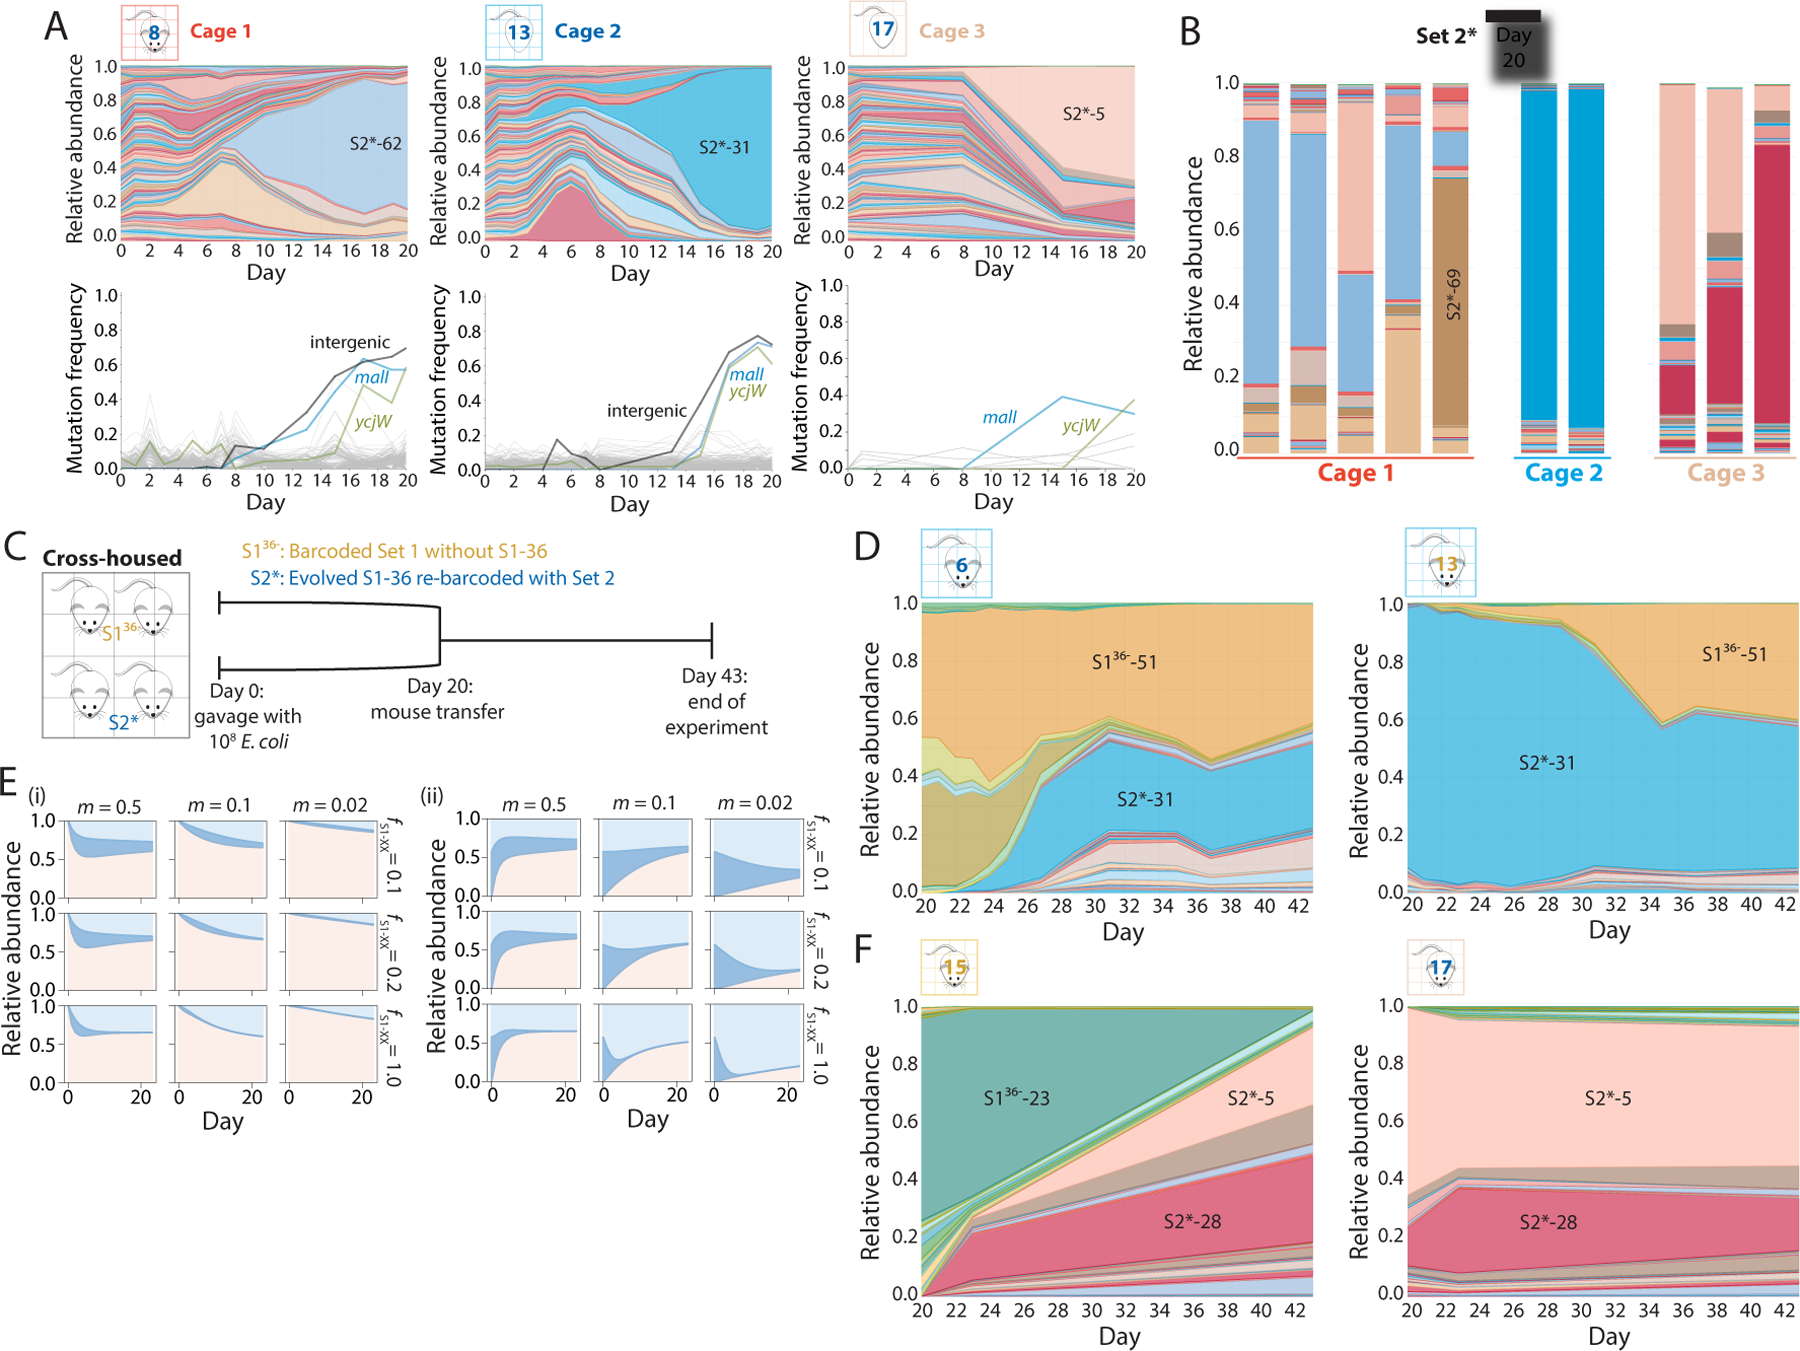
A) S2 barcodes were reintroduced into an evolved clone of S1–36 (S2* strains), used to gavage 10 germ-free mice in three cages on day 0, and tracked via daily fecal sampling for 37 days. Shown are relative abundances (top) and mutations identified from metagenomic sequencing (bottom) of the barcoded E. coli populations from a representative mouse in each cage over the first 20 days of colonization. Various barcodes emerged in each cage, but all three cages hosted bacteria with similar mutations.
B) By day 20, the relative abundances of the S2* barcodes were similar within each cage, despite differences across cages.
C) Schematic of cross-housing of S136− and S2* mice from day 20 to day 43.
D) Relative abundances of all barcodes in representative cross-housed S136− (left) and S2* (right) mice from cage 1. In the S136− mouse, S2* barcodes invaded and stabilized at ~50% relative abundance, and vice versa for the S2* mouse, suggesting that the two barcode sets have approximately equal fitness.
E) The population-genetics model applied to four cross-housed mice with three barcodes, one representing S136−-51 (light blue), one representing all S2* barcodes (pink) with the same fitness as S136−-51, and one representing all other S1 barcodes (blue), recapitulates the coexistence of S136− and S2* barcodes (D) when SS1−51 = SS2 = 0.1–1.0 and m ≈ 0.1–0.25, illustrating the general applicability of the model.
F) Relative abundances of all barcodes in representative cross-housed S136− (left) and S2* (right) mice from cage 2. In the S136− mouse, S2* barcodes invaded and took over by day 43, while S2* barcodes were able to maintain colonization in the S2* mice, indicating S2* barcodes were more fit than the S136− barcodes in this cage.