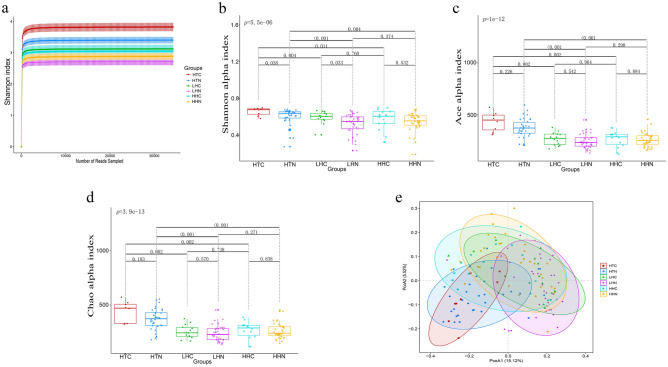
Figure 1.
Shannon rarefaction curves, α-diversity, and β-diversity of gut microbiota among the groups. (a) Shannon rarefaction curves based on OTUs among different groups are shown as a similarity threshold of 97% . 95% confidence intervals are shown as error bars. Rarefaction curves of different groups are shown in different colors. (b–d) α diversity based on the Shannon (Mothur sofware v.1.43.0, http://www.mothur.org/wiki/Shannon) (b), Ace (Mothur sofware v.1.43.0, http://www.mothur.org/wiki/Ace) (c), and Chao (Mothur sofware v.1.43.0, http://www.mothur.org/wiki/Chao) (d) index in each group are shown in the boxplots, respectively. Different colored and shaped dots represent different groups of samples. The short horizontal lines of box from top to bottom stands for 75th, 50th, and 25th percentiles, respectively. Every two sub-groups are compared in pairs by two-tailed Student’s t-test and FDR adjusted p-values are attached in the horizontal lines. e. Weighted UniFrac distance matrices based PCoA is shown as bi-dimensional scatter plots of PCoA1 and PCoA2 axis (“vegan” package in R sofware v.3.6.0, https://www.r-project.org/). Different colored and shaped dots represent different groups of samples, and different colored ellipse represents 95% confidence intervals for each group. CAD coronary artery disease, QTP Qinghai-Tibet Plateau, HTC the Tibetan CAD patients residing at QTP, HTN the Tibetan healthy individuals residing at QTP, HHC the Han CAD patients residing at QTP, HHN the Han healthy individuals residing at QTP, LHC the Han CAD patients from sea level in southern China, LHN the Han healthy individuals from sea level in southern China; operational taxonomic units (OTUs); PCoA principal coordinate analysis.

