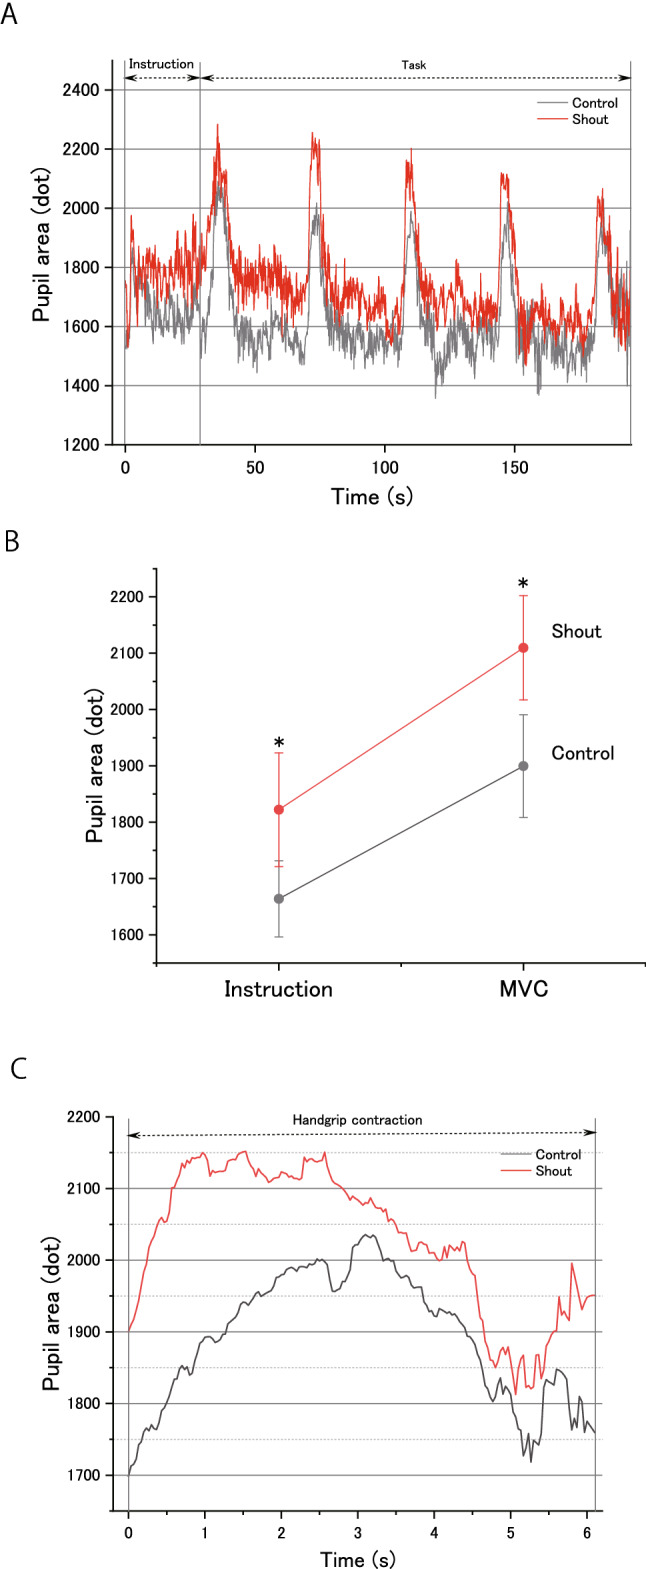
Figure 5.

Effects of shouting on pupil area over time. (A) Pupil area (dots) starting at the onset of word presentation in the experimental procedure and lasting until the end of the maximal voluntary contraction force (MVC) task. Pupil area is expressed as the mean for each experimental condition (control or shout). The data were low-pass filtered with a cut-off frequency of 1 Hz using a fourth-order Butterworth filter. Two bidirectional arrows ( ↔) indicate the period of the experimental instruction and the period of the MVC handgrip task, respectively. Instruction: experimental instruction phase. Task: MVC task phase. Pupil area (dots) is expressed as the mean during the period of the experimental instruction phase and during MVC (not during the MVC task phase) for each experimental condition (control or shout). (B) Pupil area (dots) during the period of the experimental instruction phase and during each number of squeezing a handgrip device displayed for 5 s (not during the MVC task phase) for the two experimental conditions (control or shout). (C) Averaged pupil area (dots) during squeezing a handgrip device displayed for 5 s for the two experimental conditions (control or shout). The shout condition resulted in a greater pupil area compared with the control condition. However, the result does not necessarily guarantee that the pupillary dilation by shouting causally related to the MVC enhancement: it could reflect that the pupil diameter just responded to shouting and MVC. Pupil area data (A,B) are expressed as the mean ± standard error of the mean. *P < 0.05, vs. control condition.
