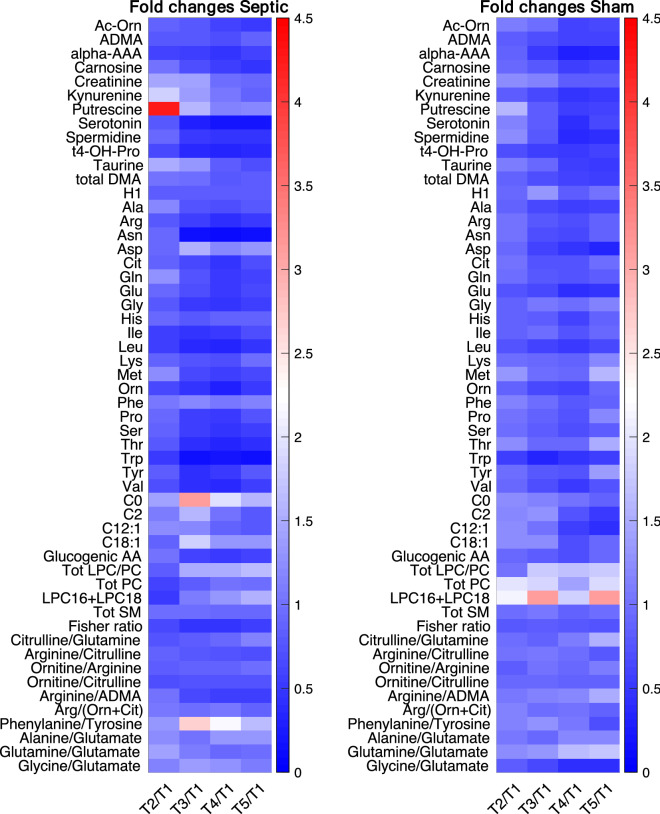
Figure 3.
Heat map for the mean values of fold changes in concentrations of plasma metabolites at all the experimental time points and baseline (T1) in septic and sham animals separately. Lipids are summed up and ratios associated to the pathways of urea and ammonia detoxification, arginine and phenylamine. For the acronyms see Table S1; AA amino acids, Glucogenic AA sum of all glucogenic amino acids (Alanine Arginine, Asparagine, Aspartic acid, Cysteine, Glutamic acid, Glutamine, Glycine, Histidine, Methionine, Proline, Serine, Valine), Tot LPC/PC ratio of the total amount of lysoPC and PC species, Tot PC total amount of PC species, LPC16 + LPC18 total amount of the most abundant lysoPC (lyso PC 16:X and lyso PC 18:X), Tot SM total amount of sphingomyelin species, Fisher ratio ratio of branched-chain AAs (leucine, valine, isoleucine) to aromatic AAs (phenylalanine, tyrosine).

