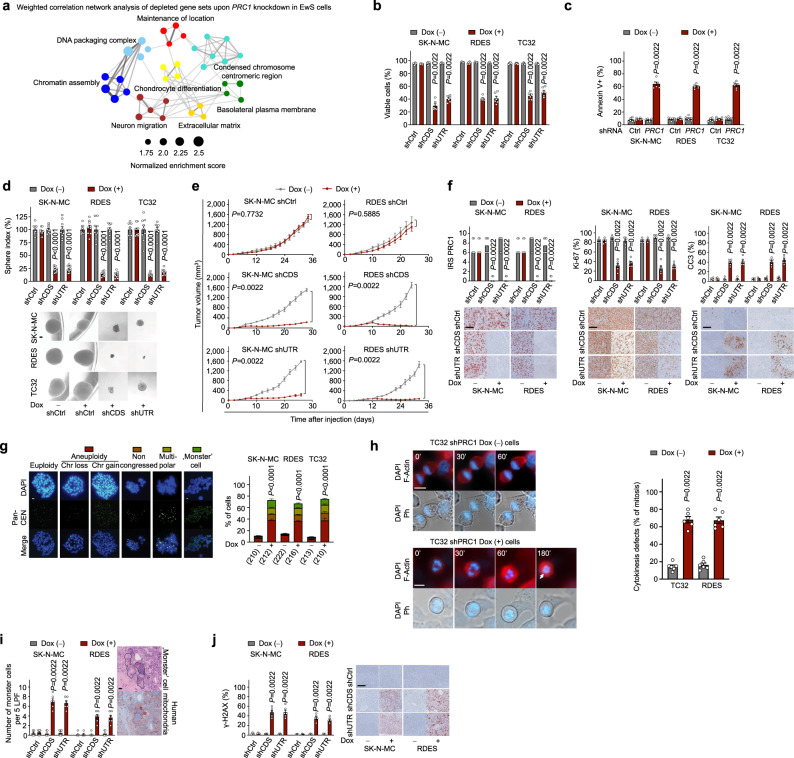
Fig. 3. PRC1 safeguards genome stability in EwS cells.
a Transcriptomic network analysis after PRC1 knockdown. b Cell viability 72 h after PRC1 silencing. Data are displayed as individual dots. Horizontal bars represent means and whiskers SEM, n = 6 biologically independent experiments; two-sided Mann-Whitney test. c Analysis of apoptosis (summary of both shPRC1). Data are displayed as individual dots. Horizontal bars represent means and whiskers SEM, n = 6 biologically independent experiments; two-sided Mann-Whitney test. d Sphere-formation after PRC1 knockdown. Data are displayed as individual dots. Horizontal bars represent means and whiskers SEM, n = 9 biologically independent experiments; two-sided Mann-Whitney test. Representative images; scale bar = 50 µm. e The volume of xenografts with/without PRC1 silencing. Data are mean and SEM, n indicates the number of animals per condition: n = 5 shCtrl and n = 6 shCDS/shUTR in both cell lines. Two-sided Mann-Whitney test. f Representative micrographs and quantifications of PRC1 (IRS), Ki-67, and cleaved caspase-3 (CC3). Data are displayed as individual dots. Horizontal bars represent median IRS of PRC1 or means and whiskers SEM for positivity, respectively; the number of animals per condition is as in e; two-sided Mann-Whitney test; scale bar = 100 µm. g Representative images (scale bar = 1 µm) and quantification of aberrant metaphases. Horizontal bars represent means and whiskers SEM, n = 6 biologically independent experiments. Parentheses indicate a total number of analyzed mitoses (summary of both shPRC1). Two-sided Chi-squared test. h (Left) Time-lapse images of TC32 cells with/without PRC1 knockdown. F-actin (red), DNA (blue). Arrows = merged nuclei. Scale bar = 10 µm. (Right) Quantification of cytokinesis failure (summary of both shPRC1). Data are displayed as individual dots. Horizontal bars represent means and whiskers SEM; n = 6 biologically independent experiments. i Representative micrographs of xenografts (H&E, human mitochondria (mt)), and quantification of, monster’ cells per low-power field (LPF). Data are displayed as individual dots. Horizontal bars represent means and whiskers SEM, the number of animals per condition is as in e; two-sided Mann-Whitney test; scale bar = 20 µm. j Representative micrographs for γ-H2AX, and quantification per HPF. Data are displayed as individual dots. Horizontal bars represent means and whiskers SEM, the number of animals per condition is as in e; two-sided Mann-Whitney test; scale bar = 100 µm.

