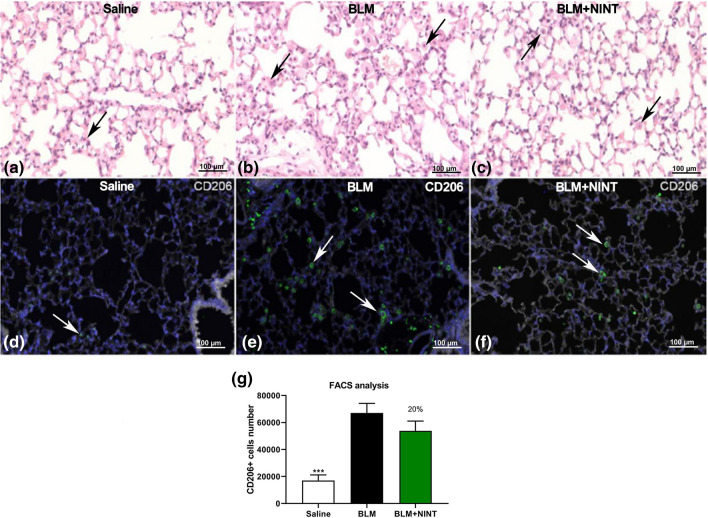
Figure 3.
Detection of macrophages in the lung tissue and BALF. Representative microphotographs of sequential sections of lung tissue of saline (a and d), BLM, (b and e) and BLM + NINT treated mice (c and f) at day 28. (a, b, c: H&E staining; d, e, f: immunofluorescent staining for CD206 and DAPI). Residual macrophage cells in lung tissue after bronchoalveolar lavage are indicated with black arrowheads in the H&E images. White arrowheads indicate macrophages expressing CD206+ in IF images. (g) Absolute number of CD206+ macrophages counted by FACS in saline, BLM and BLM + NINT-treated mice. Data are shown as mean values ± S.E.M. for 8 mice per group. Asterisks indicate significant statistical differences in comparison with BLM group (***P < 0.001; ANOVA followed by Dunnett’s test). The percentage on the BLM + NINT bars represents the inhibition effect of the treatment compared to BLM.

