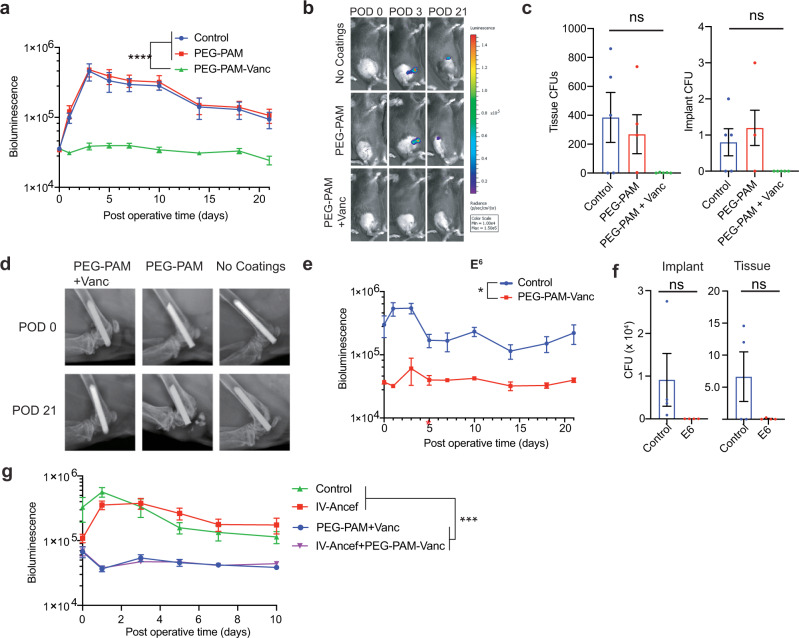
Fig. 5. PEG-PAM coatings loaded with vancomycin prevent implant infection.
a Postoperative in vivo S. aureus bioluminescence signal (mean maximum flux [photons/sec/cm2/sr] (logarithmic scale, n = 15 for no coatings group, n = 14 for PEG-PAM only group, n = 14 for PEG-PAM-Vanc group). b Representative in vivo S. aureus bioluminescence on a color scale overlaid on grayscale images of mice (c) Quantification of colony-forming units (CFUs) cultured from surrounding tissue and implant (n = 5 for no coating group, PEG-PAM group, and PEG-PAM + Vanc group). d Representative radiographs from the no coatings, PEG-PAM, PEG-PAM + Vanc groups of POD 0 and 21. e Postoperative in vivo S. aureus bioluminescence signals with 1.0 × 10⁶ CFUs loadings of bacterial challenge with PEG-PAM/Vanc coating, n = 4 for the control group, n = 6 for PEG-PAM/Vanc group for the bioluminescence measurement, n = 4 for the control group, n = 4 for PEG-PAM/Vanc group in 1.0 × 10⁶ loading group in CFU counting experiment. f Postoperative in vivo S. aureus bioluminescence signal comparison of PEG-PAM/Vanc coating, IV injection/ancef, IV injection/ancef with PEG-PAM/Vanc and control groups. (n = 8 for control group, n = 6 for PEG-PAM/Vanc group, n = 6 for IV-ancef group, n = 6 for IV-ancef + PEG-PAM/Vanc group). Statistics in (a, e, and f) are a two-way-repeated measure-ANOVA with multiple comparisons post-test. The significance between treatment groups was ****p < 0.0001 For (a), was ***p = 0.003 for (e), and ***p = 0.0004 for (g). Statistics in (c and f) are not significant using an ordinary one-way ANOVA and t-test respectively. Data is plotted showing the Mean and Standard Deviation for bar plots and Standard Error of the Mean for time longitudinal plots.

