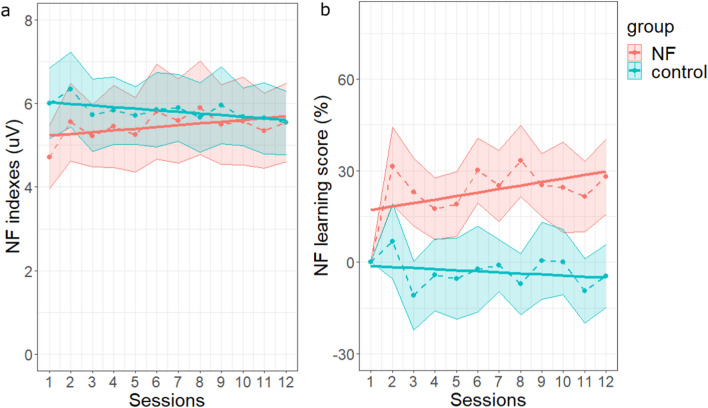
Figure 3.
Neuromodulation induced by NFT. (a) Evolution of the NF index across sessions, for the NF (in red) and the control (in blue) groups. (b) Evolution of the NF learning score across sessions. In both subplots, dotted lines and points represent the values of the NF index along the 12 sessions, averaged across participants for each group; the shaded areas represent the standard errors of the means. The solid lines represent the session effect estimated for each group from the LMM. Graphs were obtained with R software (v.4.0.2; R Core Team, 2020).

