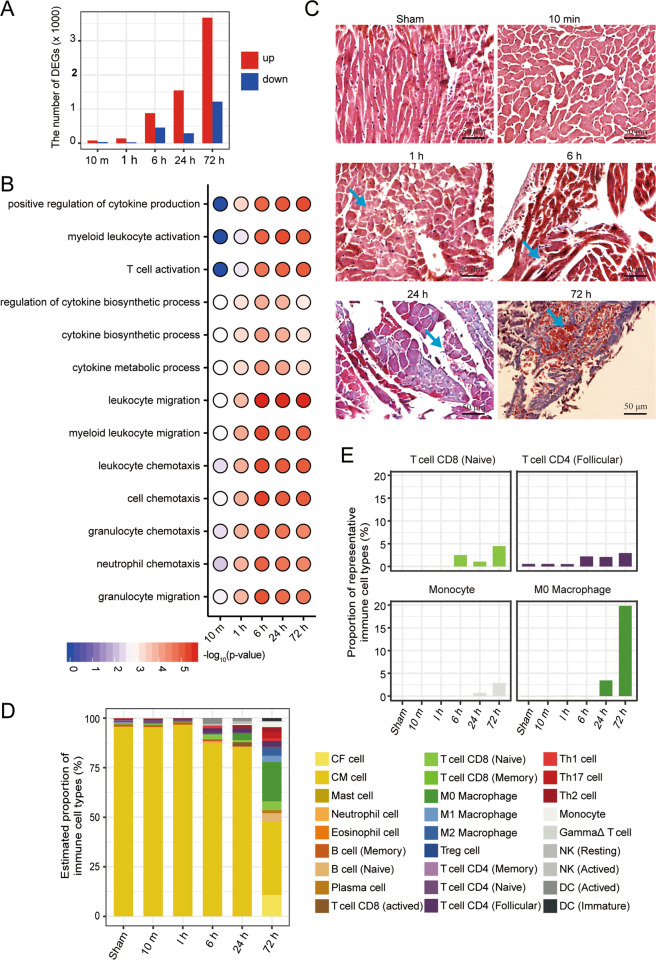
Fig. 2. Immune response at the early stage of AMI.
A The number of the differentially expressed genes (DEGs) between AMI samples and the control sample. Red: upregulated, blue: downregulated. B Bubble diagram shows the significantly enriched GO terms (biological processes) of upregulated DEGs. C Masson staining results show the morphologic changes in AMI samples compared to the control sample. The arrows indicate the damaged cardiomyocytes at 1, 6 and 24 h. At 1 h, the cytoplasm of the cardiomyocytes begins to swell, and then the cells begin to disintegrate at 6 h; the fibrosis were found around the cardiomyocytes at 24 h, and the space made by the dead cardiomyocytes was occupied by red blood cells and immune cells at 72 h (Bar = 50 μm). D The composition of immune cells in the infarcted myocardia at different stages of AMI. CM cardiac myocytes, CF cardiac fibroblasts. E The dynamic proportion of the representative types of immune cells in the course of AMI development, indicating the activation of immune infiltration.

