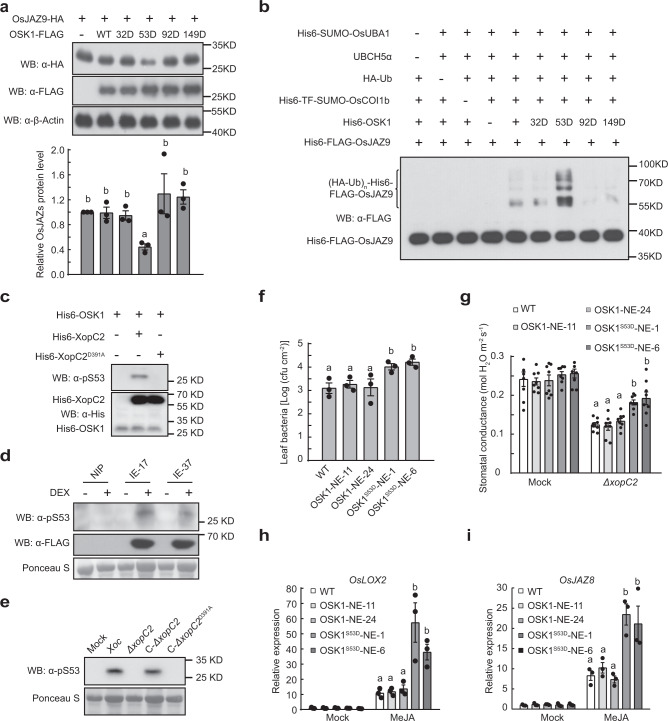
Fig. 5. XopC2 phosphorylates OSK1 at Ser53 to enhance disease susceptibility in rice.
a OsJAZ9-HA accumulation was significantly reduced when co-expressing with OSK1S53D-FLAG compared with expressing alone or with FLAG-tagged OSK1, OSK1T32D, OSK1S92D, and OSK1T149D in rice protoplasts. The chart shows the OsJAZ9-HA levels normalized to β-OsActin as evaluated by Photoshop. b OSK1S53D promoted SCFOsCOI1b-mediated OsJAZ9 ubiquitination. OsCullin1a was first incubated with Rub1, UBA3/AXR1, UBC12, RBX1, Upl1, and OsDCN1. The aliquots of the Rub1-modified OsCullin1a were then incubated with OsUBA1 (E1), UBCH5α (E2), HA-ubiquitin (Ub), OsCOI1b, OSK1, and OsJAZ9 in the ubiquitination buffer. Upl1 was used to remove TF-SUMO tag. OsJAZ9 ubiquitination was detected with an anti-FLAG antibody. c, d OSK1 was phosphorylated at Ser53 by XopC2 in vitro and in vivo. His6-XopC2 or His6-XopC2D391A was incubated with His6-OSK1 for in vitro kinase assays (c). The IE transgenic lines were treated with DEX (30 μM) or buffer (mock) before protein extraction (d). e OSK1 was phosphorylated at Ser53 in rice after Xoc infection. The wild-type plants were inoculated as described in Fig. 4b. In c–e, Ser53 phosphorylation was detected by immunoblotting with an anti-pSer53 polyclonal antibody. f Bacterial population sizes in the ΔxopC2-inoculated leaves of the wild-type and OSK1-NE-11/24 and OSK1S53D-NE-1/6 transgenic seedlings expressing OSK1 and OSK1S53D driven by the native promoter. The wild-type and transgenic rice lines were spray-inoculated as described in Fig. 2a. g Stomatal conductance in the leaves of the wild-type, OSK1-NE and OSK1S53D-NE transgenic plants after ΔxopC2 challenging. The experiment was performed as described in Fig. 2b. h, i, MeJA-induced expression of the JA-responsive gene OsLOX2 (h) and OsJAZ8 (i) in the wild-type, OSK1-NE, and OSK1S53D-NE transgenic plants. Data are shown as means ± SE (n = 3 independent experiments in a; n = 3, 8, 3 and 3 technical replicates per measurement in f, g, h, and i, respectively). All experiments were independently repeated 3 times with similar results in the panels a–i. The letters (a–b) in the panels a and f-i indicate statistically significant differences as revealed by one-way ANOVA, Tukey’s honest significance test.

