Figure 5.

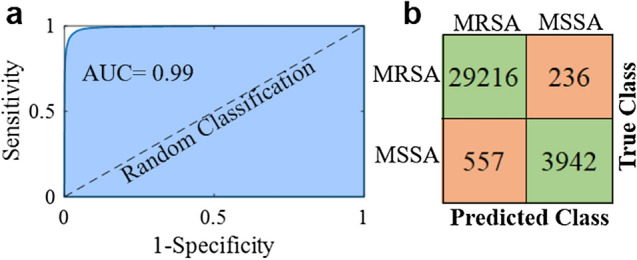
Binary classification results of MRSA and MSSA by the SAE based deep learning model. (a) The ROC curve with an AUC of 0.99. (b) Confusion matrix showing the results of ten-fold cross validated bacterial identification.

Binary classification results of MRSA and MSSA by the SAE based deep learning model. (a) The ROC curve with an AUC of 0.99. (b) Confusion matrix showing the results of ten-fold cross validated bacterial identification.