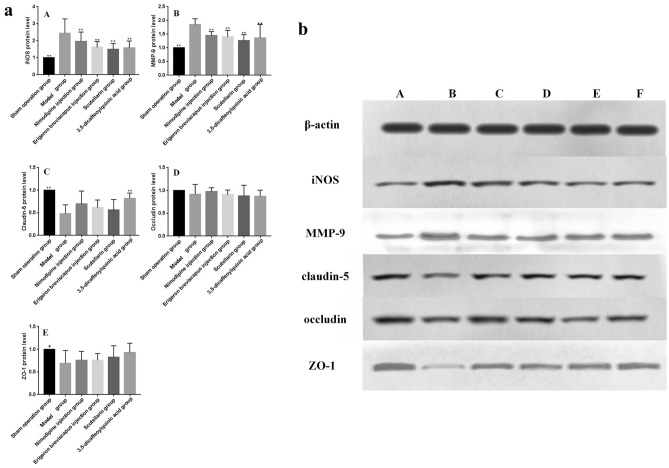
Figure 13.
(a) Effects of drugs on the expression of iNOS, MMP-9, claudin-5, occludin and ZO-1protein levels in the ischemic brain tissue of MCAO rats. (A-D) represents protein level analysis of expression of iNOS, MMP-9, claudin-5, occludin and ZO-1. The values are presented as mean ± SD. (n = 6), *compared with the model group, *P < 0.05 and **P < 0.01. (b) Immunoblotting electrophoresis map of the ROS/RNS-MMPs-TJs pathway. Related indicators in the ischemic brain tissue of rats. Sham operation group (A), model group (B), Nimodipine injection group (C), E. breviscapus injection group (D), Scutellarin group (E) and 3,5-dicaffeoylquinic acid group (F).

