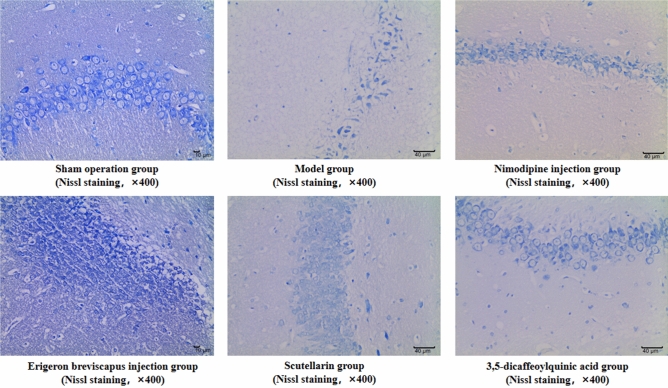
Figure 7.
Nissl bodies in the ischemic brain tissue of rats: ① three visual fields were selected for each brain tissue to collect 400-fold images, and the mean value of each visual field was taken as the cell density of the sample after counting; ② the arrow indicates Nissl body. (Scale bar: Sham operation group − 10 μm; Model control group − 40 μm; Nimodipine injection group − 40 μm; E. breviscapus injection group − 10 μm; Scutellarin group − 40 μm; 3,5-dicaffeoylquinic group − 40 μm.)

