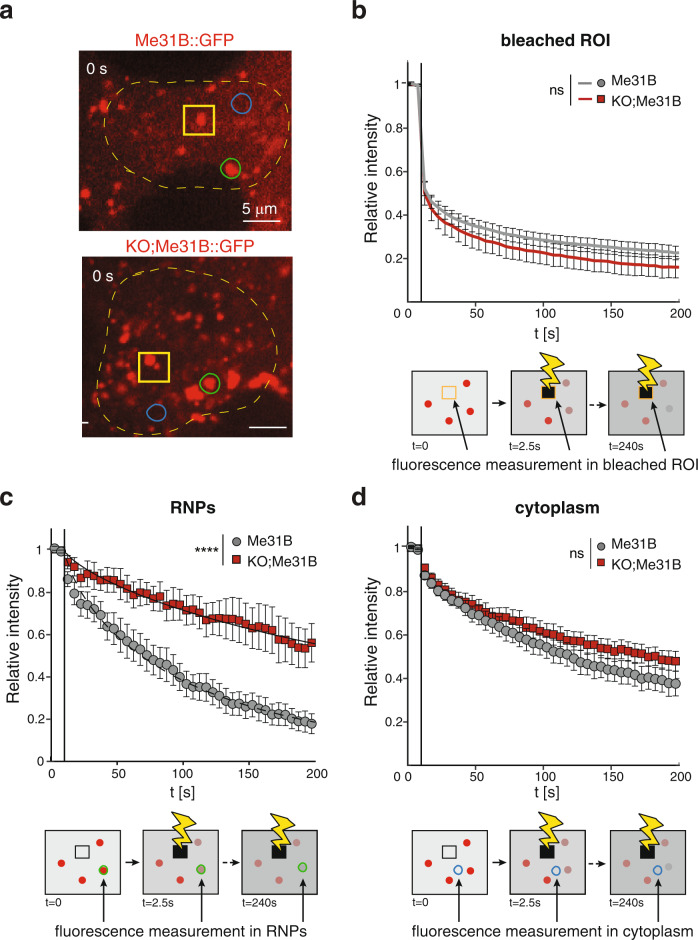
Fig. 6. Lack of Hecw alters the RNP biophysical proprieties.
a FLIP analysis was performed by repeatedly bleaching a randomly selected ROI (indicated by a yellow square) and by monitoring and quantifying the fluorescence level as a function of time in the same region, in single RNPs outside the bleached area (green circle), and in neighbouring portions of the cytoplasm (blue circle). One representative image for each genotype is shown. In (b), (c) and (d), the relative intensity of Me31B::GFP fluorescence in the three regions: bleached area, RNPs and cytoplasm, respectively, is plotted as a function of time for both control and HecwKO. Data are reported as mean ± SD. ****P < 0.0001 by two-tailed Mann–Whitney test (n = 18 samples/genotype). Both in the bleached area and in the cytoplasm, the loss curves show no statistically significant difference (P = 0.07 by t-student) between control and HecwKO, whereas a highly significant difference is observed for RNPs.

