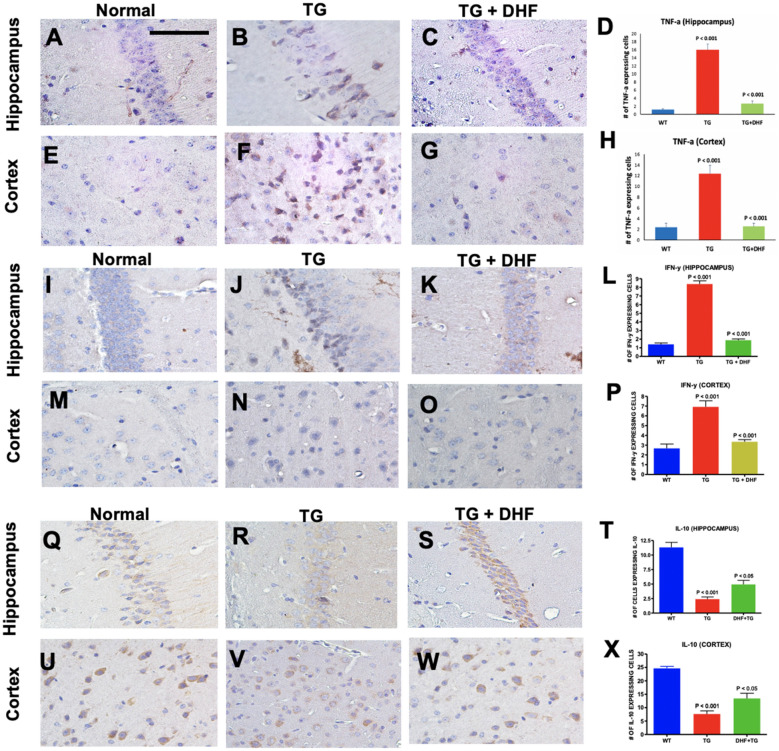
Figure 5.
DHF treatment shifts the cytokine profile from Th1 towards Th2 response. Legend: TNF-a, IFN-y and IL-10 expression in the hippocampus and cortex of Wild Type (WT), Tg26, and DHF treated Tg26 mice (A–X). Immunohistochemical stained sections show TNF-a, IFN-y and IL-10 expressing cells in the hippocampal and cortex regions of the mice brains. 3 WT mice, 3 Tg26 mice, and 4 TG + DHF mice were used for TNF-a. 3 WT mice, 5 Tg26 mice, and 4 TG + DHF mice were used for IFN-y and IL-10. A, B, C, E, F, G, I, J, K, M, N, O, Q, R, S, U, V and W are 400 × magnification pictures of the hippocampus and cortex regions of the mice. (D) Quantification of TNF-a expressing cells in the hippocampus: p < 0.001, WT versus Tg; p < 0.001 Tg versus Tg + DHF. (H) Quantification of TNF-a expressing cells in cortex: p < 0.001, WT versus Tg; p < 0.001, Tg versus Tg + DHF. (L) Quantification of IFN-Y expressing cells in the hippocampus: p < 0.001, WT versus Tg; p < 0.001, Tg versus Tg + DHF. (P) Quantification of IFN-Y expressing cells in cortex: p < 0.001, WT versus Tg; p < 0.001, Tg versus Tg + DHF. (T) Quantification of IL-10 expressing cells in the hippocampus: p < 0.001, WT versus Tg; p < 0.05, Tg versus Tg + DHF. (X) Quantification of IL-10 expressing cells in cortex: p < 0.001, WT versus Tg; p < 0.05, Tg versus Tg + DHF. The total numbers of hippocampal fields analyzed (WT, Tg26, TG + DHF) for each antibody were TNF-a (55, 87, 104), IFN-y (154, 72, 101), IL-10 (84, 164, 119). The total numbers of cortex fields analyzed (WT, Tg26, TG + DHF) for each antibody were TNF-a (30, 30, 40), IFN-y (15, 25, 20), IL-10 (10, 18, 19). One Way ANOVA with Bonferroni's Multiple Comparison post- test. scale bar, 100 μm.

