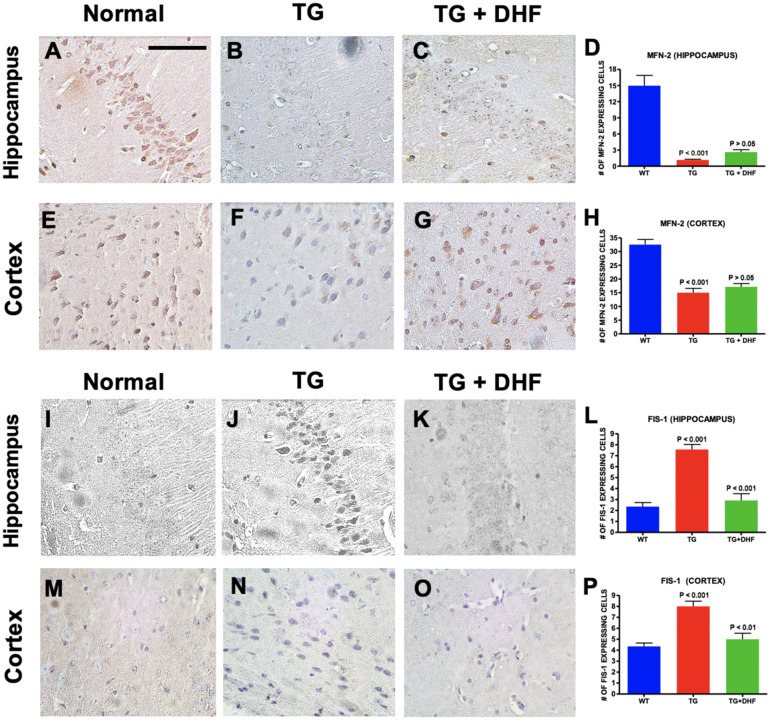
Figure 7.
DHF treatment improved mitochondrial fission, but not fusion. Legend: MFN-2 and FIS-1 expression in the hippocampus and cortex of Wild Type (WT), Tg26, and DHF treated Tg26 mice (A-P). Immunohistochemical stained sections show MFN-2 and FIS-1 expressing cells in the hippocampal and cortex regions of the mice brains. 4 WT mice, 5 Tg26 mice, and 4 TG + DHF mice were used for MFN-2. 4 WT mice, 3 Tg26 mice, and 3 Tg + DHF mice were used for FIS-1. A, B, C, E, F, G, I, J, K, M, N, and O are 400 × magnification pictures of the hippocampus and cortex regions of the mice. (D) Quantification of MFN-2 expressing cells in the hippocampus: p < 0.001, WT versus Tg; p > 0.05, Tg versus Tg + DHF. (H) Quantification of MFN-2 expressing cells in cortex: p < 0.001, WT versus Tg; p > 0.05, Tg versus Tg + DHF. (L) Quantification of FIS-1 expressing cells in the hippocampus: p < 0.001, WT versus Tg; p < 0.001, Tg versus Tg + DHF. (P) Quantification of FIS-1 expressing cells in cortex: p < 0.001, WT versus Tg; p < 0.01, Tg versus Tg + DHF. The total numbers of hippocampal fields analyzed (WT, Tg26, TG + DHF) for each antibody were MFN-2 (103, 93, 63), FIS-1 (40, 30, 33). The total numbers of cortex fields analyzed (WT, Tg26, TG + DHF) for each antibody were MFN-2 (17, 22, 18), FIS-1 (20, 20, 15). One Way ANOVA with Bonferroni's Multiple Comparison post-test. scale bar, 100 μm.

