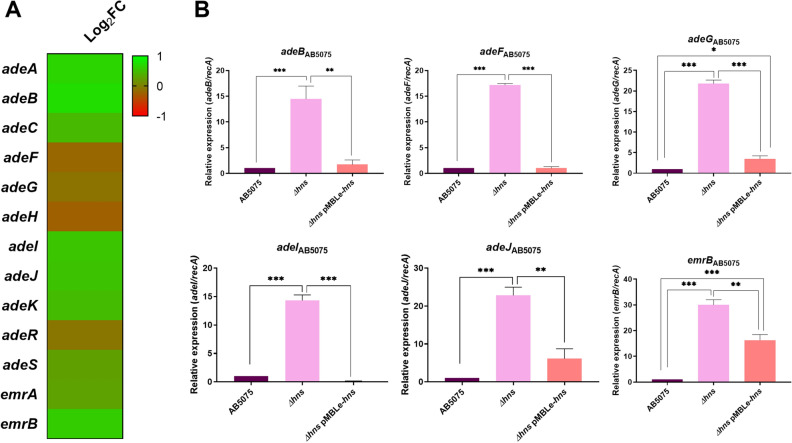
Figure 2.
Genetic analysis of efflux pumps coding genes. (A) Heatmap outlining the differential expression of genes associated with efflux pumps in A. baumannii AB5075 Δhns vs. parental strain. The asterisks represent the DEGs (adjusted P-value < 0.05 with log2fold change > 1). Heat map was performed using GraphPad Prism version number 9 (GraphPad software, San Diego, CA, USA, https://www.graphpad.com/). (B) qRT-PCR of AB5075, AB5075 Δhns and AB5075 Δhns pMBLe-hns strains genes associated with efflux pumps, the expression levels and the fold changes were determinate using the double ΔCt analysis. At least three independent samples were used, and three technical replicates were performed from each sample. Statistical significance (P-value < 0.05) was determined by ANOVA followed by Tukey’s multiple comparison test; one asterisks: P-value < 0.05; two asterisks: P-value < 0.01 and three asterisks: P-value < 0.001. This figure was performed using GraphPad Prism version number 9 (GraphPad software, San Diego, CA, USA, https://www.graphpad.com/).

