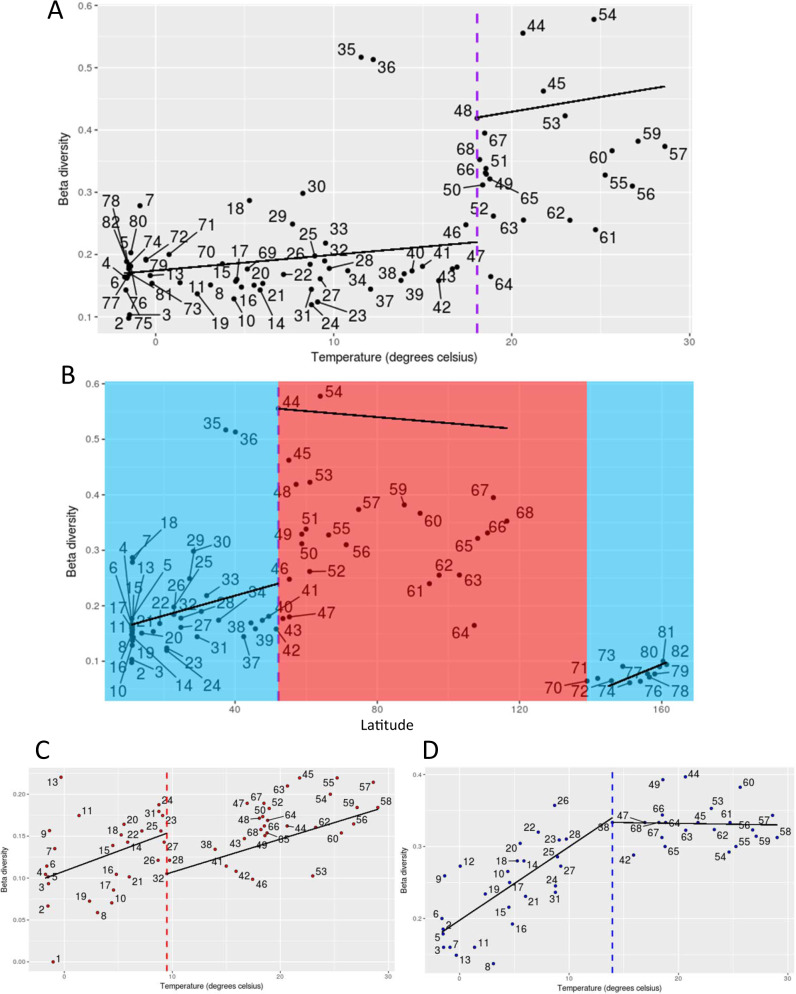
Fig. 5. Beta diversity break-point analyses.
A,B Represent breakpoints of protein families as part of the metatranscriptome dataset. C, D Represent breakpoints of the 18S rDNA and 16S rDNA datasets. The numbers correspond to sample locations as shown in Fig. 1A. The y-axis represents beta diversity across all stations. The x-axis in A, C and D represents temperature and in B represents latitude. The horizontal lines indicate the breakpoints in beta diversity. For the Pfam protein families dataset in (A), the breakpoint is at 18.06 °C with a p-value of 3.741e−10. In B the breakpoint is at 52.167 degrees altered latitude (37.833 degrees latitude) with a p-value of 2.225e−07. For the 16S rDNA dataset in (C), the breakpoint is at 9.49 °C with a p-value of 1.413e−4. For the 18S rDNA dataset in (D), the breakpoint is at 13.96 °C with a p-value of 8.407e−11.

