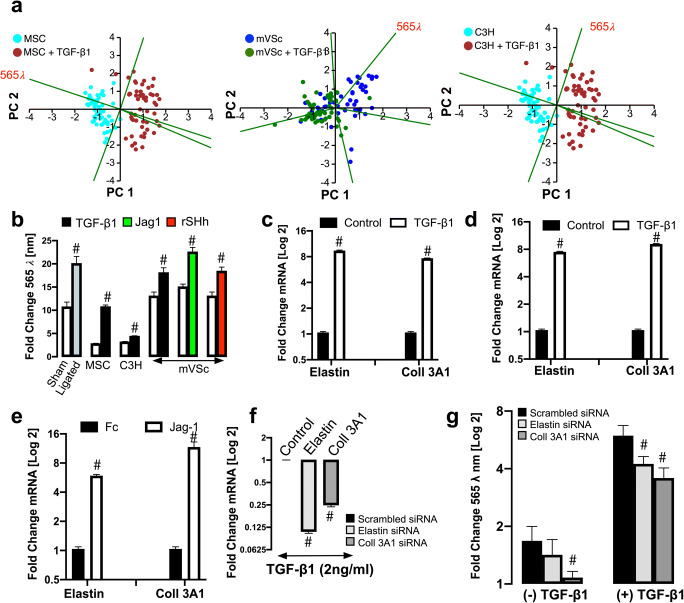
Fig. 10.
Elastin and Coll 3A1 contribute to the photonic intensity of stem cell-derived myogenic progeny at λ565 ± 20 nm wavelength. (a). PCA biplots of single cell photon analysis from MSC, mVSc and C3H/10 T1/2 cells in the absence or presence of TGF-β1. Each λ variable in the PCA biplot is representative of the eigenvectors (loadings). The λ565 variable strongly influences PC1 when cells undergo myogenic differentiation. (b). Log2 fold changes in single cell photon emissions at λ565 nm in sham and ligated cells ex vivo, MSC and mVSc following myogenic differentiation. Data are the mean ± SEM of 55–178 cells/group, #p≤0.01. (c). Log2 fold changes in mRNA levels for elastin and Coll3A1 in MSCs following treatment with TGF-β1 for 7 d. Data are the mean ± SEM of n= 3, #p≤0.05 vs control. (d). Log2 fold changes in mRNA levels for elastin and Coll 3A1 in mVSc following treatment with TGF-β1 for 7 d. Data are the mean ± SEM of n= 3, #p≤0.05 vs control (e). Log2 fold changes in mRNA levels for elastin and Coll 3A1 in mVSc following treatment with Jag1 for 7 d. Data are the mean ± SEM of n= 3, #p≤0.05 vs Fc control. (f). Log2 fold changes in mRNA levels for elastin and Coll3A1 in response to TGF-β1 (2 ng/mL) following siRNA knockdown of elastin and Coll3A1, respectively. Data are the mean ± SEM of n= 3, #p≤0.05 vs scrambled control. (g). Log2 fold changes in single cell photon emissions at λ565 nm in response to TGF-β1 (2 ng/mL) following siRNA knockdown of elastin and Coll3A1, respectively. Data are the mean ± SEM of n= 3, #p≤0.05 vs scrambled control

