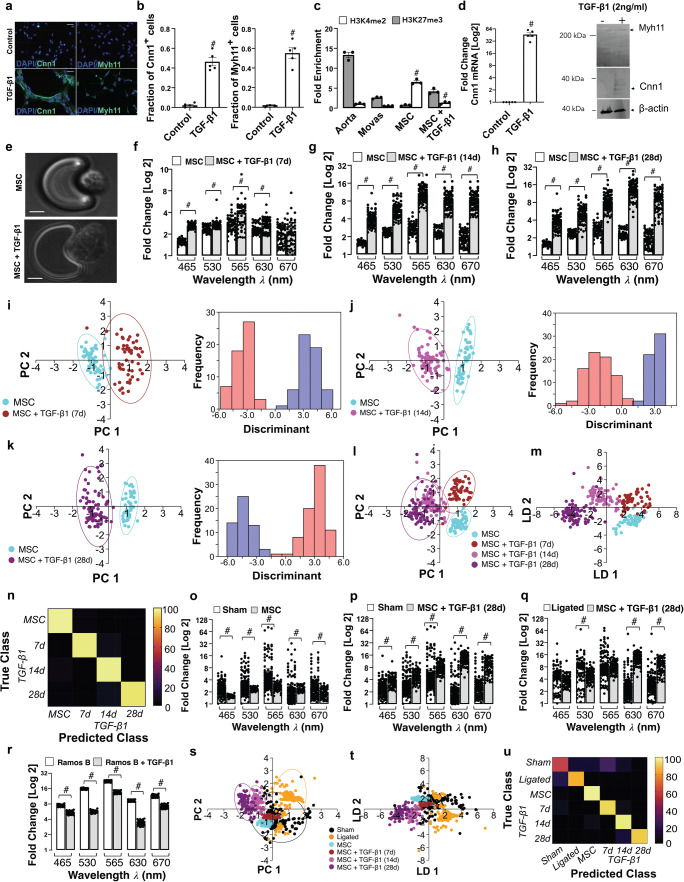
Fig. 3.
Single cell photonics of murine bone marrow-derived mesenchymal stem cells (mMSCs) before and after myogenic differentiation in vitro. (a). Representative immunocytochemical analysis of Cnn1 (green), Myh11 (green) and DAPI nuclei staining (blue) in mMSCs before and after treatment of cells with media supplemented with TGF-β1 (2 ng/mL). (b). The fraction of Cnn1+ and Myh11+ cells before and after treatment of cells with media supplemented with TGF-β1 (2 ng/mL). Data are the mean ± SEM of 5 wells, #p<0.05 vs control. (c). Fold enrichment of the stable SMC histone modification, H3K4me2 and repressive histone modification, H3K27me3 at the Myh11 promoter in fresh mouse aorta, cultured Movas SMCs and undifferentiated mMSCs in the absence or presence of TGF-β1 (2 ng/mL) for 7d. Data are mean ± SEM of a representative experiment performed in triplicate, #p<0.05 vs control (−) TGF-β1 levels. (d). Log2 fold change in Cnn1 mRNA levels in mMSCs and representative immunoblot of Cnn1 and Myh11 protein expression in lysates in response to TGF-β1 (2 ng/mL). Data are mean ± SEM of n=5, #p≤0.05 considered as significant. (e). Visualisation of MSCs and their myogenic progeny on each V-cup in the LoaD platform. (f-h). Single cell photon emissions from MSCs in the absence or presence of TGF-β1 (2 ng/mL) for (F) 7 (G) 14 and (H) 28 d in vitro. Data are the Log2 fold increase and represent the mean ± SEM of 55–79 cells/group, #p≤0.001. (i-k). LDA plots of MSC (cyan) before and after treatment with TGF-β1 (2 ng/mL) for 7d (brown), 14d (magenta) and 28d (purple) cells in vitro. Data are the Log2 fold increase and represent the mean ± SEM of 55–79 cells/group, #p<0.001. (l-m). Combined PCA loading plots and LDA of MSCs and MSCs following treatment with TGF-β1 for 7, 14 and 28d. Data are from 55 to 79 cells/group. (n). Confusion matrix of true class and predicted class following a leave-one-outcross-validation procedure by the LDA classifier. Data are from 268 cells across five wavelengths. (o-q). Single cell photon emissions from MSCs in the absence or presence of TGF-β1 (2 ng/mL) 28 d in vitro compared to (O,P) sham and (Q) ligated cells ex vivo. Data are the Log2 fold increase and represent the mean ± SEM of 55–178 cells/group, #p≤0.001 vs Sham (O,P) Ligated (Q). (r). Single cell photon emissions from Ramos B cells in the absence or presence of TGF-β1 (2 ng/mL) 14d. Data are the Log2 fold increase and represent the mean ± SEM of 55 cells/group, #p<0.001. S-T. PCA loading plots (s) and LDA (t) of sham (black), ligated (orange) and MSC (cyan) before and after myogenic differentiation with TGF-β1 for 7d (brown), 14d (magenta) and 28d (purple). Data are from 624 cells across 5 wavelengths. (u). Confusion matrix of true class and predicted class following a leave-one-outcross-validation procedure by the LDA classifier. Data are from 624 cells across 5 wavelengths

