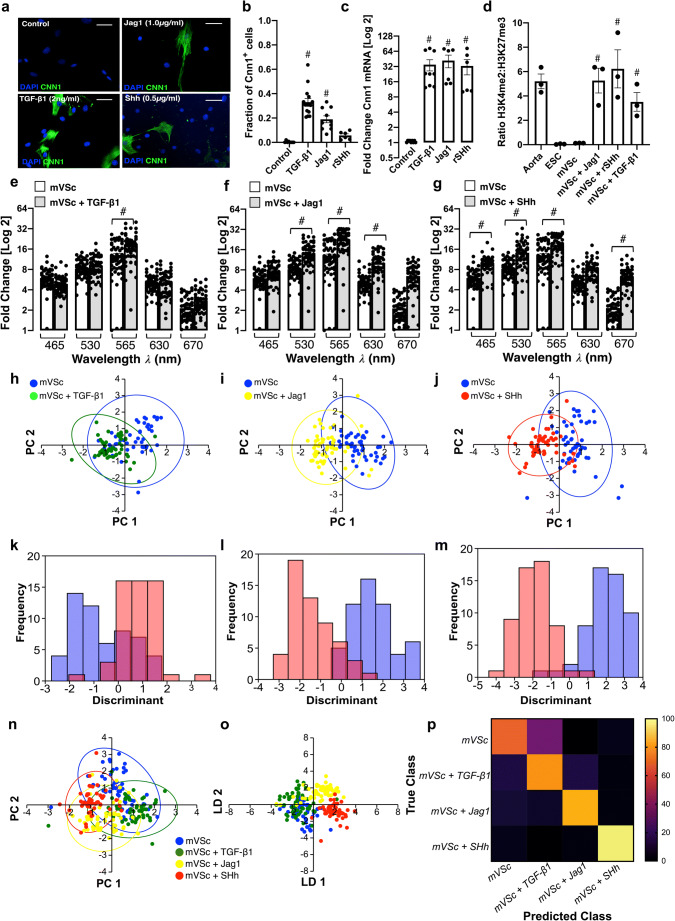
Fig. 6.
Single cell photonics of S100β+ vascular stem cells (mVSc) before and after myogenic differentiation in vitro. (a). Representative immunocytochemical analysis of Cnn1 (green) and DAPI nuclei staining (blue) in mVSc before and after treatment of cells with media supplemented with TGF-β1 (2 ng/mL), Jag1 (1 μg/mL) and SHh (0.5 μg/mL) for 14d. (b). The fraction of Cnn1+ cells before and after treatment of cells with media supplemented with TGF-β1 (2 ng/mL), Jag1 (1 μg/mL) and SHh (0.5 μg/mL) for 14d. Data are the mean ± SEM of 3 experiments, #p≤0.05 vs control. (c). Log2 fold change in Cnn1 mRNA levels before and after treatment of cells with media supplemented with TGF-β1 (2 ng/mL), Jag1 (1 μg/mL) and SHh (0.5 μg/mL) for 7d. Data are the mean ± SEM n=3, #p≤0.05 vs control. (d). Fold enrichment of the stable SMC histone modification, H3K4me2 and repressive histone modification, H3K27me3 at the Myh11 promoter in fresh mouse aorta (Aorta), mouse embryonic stem cells (ESC), and undifferentiated S100β+ mVSc before (mVSc) and after treatment of cells with media supplemented with TGF-β1 (2 ng/mL), Jag1 (1 μg/mL) and SHh (0.5 μg/mL) for 7 d. Data are representative of n=3, #p<0.05 vs control. (e-g). Single cell auto-fluorescence photon emissions from mVSc in the absence or presence TGF-β1 (2 ng/mL), Jag1 (1 μg/mL) and SHh (0.5 μg/mL) for 14 d in vitro. Data are the Log2 fold increase and represent the mean ± SEM of 55 cells/group, #p≤0.001 vs control. (h-j). Individual PCA loading plots of mVSc before (blue) and after myogenic differentiation with (h) TGF-β1 (green), (i) Jag1 (yellow) and (j) SHh (red). (k-m). Individual LDA plots of mVSc before and after myogenic differentiation with (k) TGF-β1, (l) Jag1 and (m) SHh. (n). Cumulative PCA loading plots of mVSc before (blue) and after myogenic differentiation with (h) TGF-β1 (green), (i) Jag1 (yellow) and (j) SHh (red). (o). Cumulative LDA plots of mVSc before and after myogenic differentiation with (k) TGF-β1, (l) Jag1 and (m) SHh. (p). Confusion matrix of true class and predicted class following a leave-one-outcross-validation procedure by the LDA classifier. Data are from 219 cells across five wavelengths

